Chart of the week: Barclays sell-off over?
24th November 2014 11:07
by John Burford from interactive investor
Share on
John Burford is author of Tramline Trading and editor of MoneyWeek Trader
In these articles, I will highlight a share that I believe has an interesting chart pattern. I am primarily a technical trader and use the methods I have developed that I call Tramline Trading. You can read more about my methods in my book Tramline Trading, which you can inspect here.
Most traders and investors make classic errors by chasing a stock near a top and then hang on to it too long during the decline. You will vastly improve your performance by timing your entries and exits more expertly – and that is what I hope to help you with.
My goal in these articles is to cover a share that has an interesting chart. I I developed my tramline system over several years to give me a set of rules which can provide me with trade entries at low risk. The low risk requirement was crucially important because no matter how firmly I believe in my trade, I could be wrong! And I wanted my wrong trades to hand me the smallest possible loss to my account. I figured the winners would take care of themselves.
My hope is that you glean useful ideas and employ at least some technical analysis to bolster your returns. In trading as well as investing, timing is a key factor in your eventual returns.
Is Barclays a buy?
Today, large British banks are about as unloved by the public as they have ever been. From the forex-fixing scandals of the investment arms to the PPI mis-selling scandals of the retail arms, millions of pounds are being transferred back the Exchequer in the form of mega-fines. The latest developing scandal now is pensions (annuities) mis-selling. The amounts involved are massive
Some are saying this is deferred pay-back for bailing them out during the Credit Crunch. It's a kind of a "pay Peter to rob Paul" effect. That is especially relevant in the case of - a taxpayer-owned bank.
Incidentally, investors with an ethical approach to investing must be asking themselves if banking shares really are suitable for them.
But as a major UK bank which more or less escaped the Credit Crunch of 2007 - 2009 relatively unscathed, presents an interesting share from a trading perspective. For dividend-hunters, it is not especially appealing with a recent yield of around 2-3%. With huge pressure on all banks to clean up their acts, and the prospect of tougher retail banking conditions ahead, what are the charts saying?
Here is the daily chart going back to 2010:
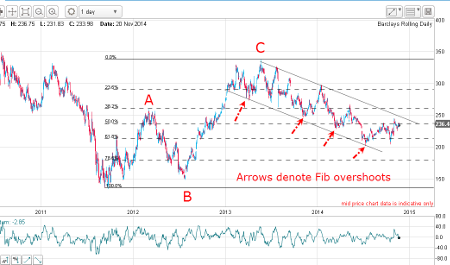
(click to enlarge)
The late 2011 lows were made after a solid downtrend and the subsequent rally into 2013 was in a classic A-B-C form (see text pp 89 - 90, 97 - 104). The point about an A-B C is that when the C wave has terminated, the main trend down resumes.
That places the C wave in a terrific position for trade timing. If you can correctly identify the end of a C wave, you can enter a trade early in the new trend and ride it a long way.
And from the 2013 C wave highs, the market has been trending lower in a series of heavily overlapping waves.
The interesting observation about this decline is that it has made overshoots of all of the Fibonacci levels - the 23%, the 38%, the 50% and the 62%. Normally, I would expect pretty accurate hits on these levels before staging bounces.
This is telling me that selling on the way down has been heavy.
The latest test of the Fibonacci 62% level last month was another overshoot. This 62% level is the most common retracement of a previous wave and is usually a good place either to take profits on a short trade, or to probe the long side, expecting a significant upward bounce.
On the other hand, the 62% level is often the starting point for a more substantial rally. Here is a close-up showing my tramlines which the market has been following off the high:
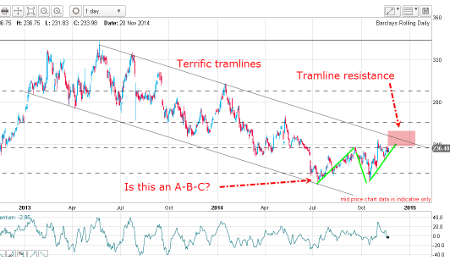
(click to enlarge)
The market made two tests of the 200p lows in recent months and the latest bounce off the October low is taking the form of an A-B-C. Because this pattern is counter-trend, it should eventually reverse.
And the ideal place for this reversal is from the upper tramline (see text, pp 116 - 118) around the 240 - 250 area (marked in pink). Remember, tramlines are lines of support and resistance that the market has respected.
This is a wonderful example of how markets often follow a trend by moving in the trading channel formed between the tramlines. Normally, a market will bounce off well-formed tramlines in a continuation of the trend. These are excellent places to enter low-risk trades because if the tramline is broken, that is a sign the trend has very likely changed - and you would want to question your position at the very least.
Outlook
Rallies should be contained by my upper tramline and unless this line is broken in a major way, the trend remains down.
If my upper tramline can be solidly broken, I would take that as an indication the market wants to move up to the 250 - 260 area (a Fibonacci 50% retrace of the entire move down).
These articles are provided for information purposes only. Occasionally, an opinion about whether to buy or sell a specific investment may be provided by third parties. The content is not intended to be a personal recommendation to buy or sell any financial instrument or product, or to adopt any investment strategy as it is not provided based on an assessment of your investing knowledge and experience, your financial situation or your investment objectives. The value of your investments, and the income derived from them, may go down as well as up. You may not get back all the money that you invest. The investments referred to in this article may not be suitable for all investors, and if in doubt, an investor should seek advice from a qualified investment adviser.
Full performance can be found on the company or index summary page on the interactive investor website. Simply click on the company's or index name highlighted in the article.
Disclosure
We use a combination of fundamental and technical analysis in forming our view as to the valuation and prospects of an investment. Where relevant we have set out those particular matters we think are important in the above article, but further detail can be found here.
Please note that our article on this investment should not be considered to be a regular publication.
Details of all recommendations issued by ii during the previous 12-month period can be found here.
ii adheres to a strict code of conduct. Contributors may hold shares or have other interests in companies included in these portfolios, which could create a conflict of interests. Contributors intending to write about any financial instruments in which they have an interest are required to disclose such interest to ii and in the article itself. ii will at all times consider whether such interest impairs the objectivity of the recommendation.
In addition, individuals involved in the production of investment articles are subject to a personal account dealing restriction, which prevents them from placing a transaction in the specified instrument(s) for a period before and for five working days after such publication. This is to avoid personal interests conflicting with the interests of the recipients of those investment articles.