Chart of the week: FTSE 100 forecast and bellwether warning
15th December 2014 10:54
by John Burford from interactive investor
Share on
By John C Burford, author of Tramline Trading, and editor MoneyWeek Trader
In these weekly articles, I will highlight a share that I believe has an interesting chart pattern. I am primarily a technical trader and use the methods I have developed that I call Tramline Trading. You can read more about my methods in my book Tramline Trading, which you can inspect here.
Most traders and investors make classic errors by chasing a stock near a top and then hang on to it too long during the decline. You will vastly improve your performance by timing your entries and exits more expertly - and that is what I hope to help you with.
My goal in these articles is to cover a share that has an interesting chart. I developed my tramline system over several years to give me a set of rules which can provide me with trade entries at low risk. The low risk requirement was crucially important because no matter how firmly I believe in my trade, I could be wrong! And I wanted my wrong trades to hand me the smallest possible loss to my account. I figured the winners would take care of themselves.
My hope is that you glean useful ideas and employ at least some technical analysis to bolster your returns. In trading as well as investing, timing is a key factor in your eventual returns.
Has British Land run out of space (on the charts)?
British Land, founded in 1849, is one of Britain's largest commercial property developers. It has a major presence in London where it owns the famous 'Cheese Grater' building.
It is also a major player in the REIT market.
The profits and value of the company shares are very much tied to land values and the general economy, which, as we all know, have been on an upward curve in recent years. This has lead to a boom in prime London commercial real estate.
But my question is this: is the party ending?
The omens are piling up that indicate the global - and UK - economy is screeching to a halt and very likely will go into reverse. Also, sentiment appears to be rapidly turning negative. If true, this will put London's eye-watering land valuations in severe jeopardy.
I happen to believe that valuations of any asset market - be it gold, shares, bonds, land, art, vintage cars - are determined by market sentiment. It is no use to you if you believe a share is undervalued (bullish) when large players are selling (bearish). You are likely to be flattened by the steamroller.
It is the weight of money selling an asset over the weight of buying that sets a bear trend (and vice versa). My guess is that not one person in a hundred understands what moves market prices. Many believe it is more buyers than sellers that drive prices up. Others believe if an asset is fundamentally undervalued, its price will rise.
It is none of these. What makes a share rise from 102 to 103 in the next tick? It is an agreement between the willing buyer and the willing seller that the price should move from 102 to 103. Nothing more and nothing less. And that is a direct consequence of sentiment.
As a barometer of sentiment, the stock market happens to be one of the most sensitive. That is why all traders/investors in UK shares must keep an eye on the overall market, the FTSE 100. If it is rising, then sentiment is positive and most shares should be in bull trends (and vice versa).
So what is the technical position of the FTSE 100? This is my assessment of it, and it looks dire:
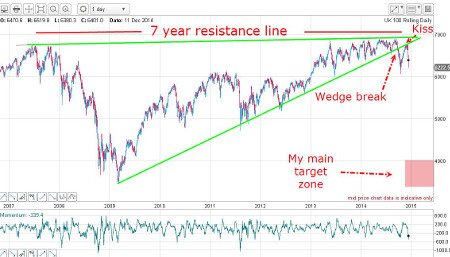
This chart contains several key points:
- I have a seven-year resistance line where no trading has taken place above this line. Since mid-2013, the market has made multiple attempts at breaking above it; all to no avail. The market obviously respects this line and it would take enormous buying strength to push above it. Therefore, the path of least resistance from this line is down.
- I can draw a multi-year wedge (see text, pp 33–38, 71–80, 152). The wedge is one of the most powerful chart patterns in the book - and is one of my favourites to trade. That is because when a wedge is broken to the downside - as here - the market usually retraces 100% of the wedge height - in this case, to the marked pink zone. That would represent a drop of around 50% at a minimum.
- The lower wedge line has been broken and the market has staged a traditional kiss to the line. Following the kiss, the line was bid farewell in a scalded cat bounce (see text, pp 83-84, 143). The kiss is a give-away that the trend has changed.
The bottom line is this: Market sentiment is turning negative and bellwethers of the domestic UK economy such as British Land will be running into massive headwinds.
The hourly FTSE chart shows a magnificent example of a third Elliott wave:
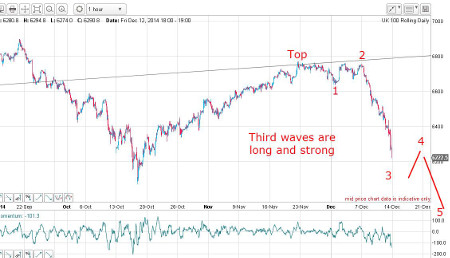
Third waves are ideally long and strong and this is a beautiful example. Where this third wave will end is an open question, but when it does, a rally in a fourth wave will appear. And when that wave terminates, a fifth wave will drive prices to new lows - probably below the 16 October low at 6075.
Incidentally, the red bars are not necessarily to scale in the above chart - the market will decide where the waves will appear.
Regardless, the trend is down.
The charts - my outlook
Here is the daily British Land daily chart:
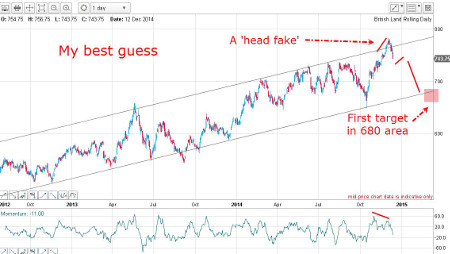
The market has been in an uptrend for some time, but last week's rally into last week's high was unmatched by the general FTSE market decline. There is also a tell-tale negative momentum divergence (red bars), which points to a weakening rally into the high. That is a bearish sign.
The final thrust up to the 2 December high has poked above my upper tramline in a 'head fake' (see text, pp 71–73). This is a notorious pattern that signals a reversal - usually swiftly back down to the lower tramline.
Here is the hourly chart:
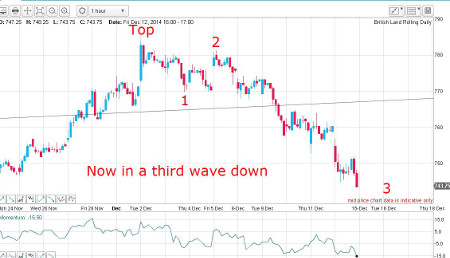
From the high we have wave 1 down, then wave 2 up and the big slide last week is wave 3. This has taken the market back inside the trading channel contained by my tramline pair.
How do I know it is wave 3 (see text, pp 118-120)? Simply because third waves are long and strong - and this one certainly is.
The Elliott waves are forming in textbook fashion. And when we see a wave 4 up and a wave 5 down to a new low, that will be the sign that the bear trend has truly started in earnest.
My conclusion: the market will likely fall back to the lower tramline to my first target within days/weeks.
A break of the lower tramline will herald a much steeper decline to the 600 area. Much lower prices are likely thereafter.
This article is for information and discussion purposes only and does not form a recommendation to invest or otherwise. The value of an investment may fall. The investments referred to in this article may not be suitable for all investors, and if in doubt, an investor should seek advice from a qualified investment adviser.
These articles are provided for information purposes only. Occasionally, an opinion about whether to buy or sell a specific investment may be provided by third parties. The content is not intended to be a personal recommendation to buy or sell any financial instrument or product, or to adopt any investment strategy as it is not provided based on an assessment of your investing knowledge and experience, your financial situation or your investment objectives. The value of your investments, and the income derived from them, may go down as well as up. You may not get back all the money that you invest. The investments referred to in this article may not be suitable for all investors, and if in doubt, an investor should seek advice from a qualified investment adviser.
Full performance can be found on the company or index summary page on the interactive investor website. Simply click on the company's or index name highlighted in the article.
Disclosure
We use a combination of fundamental and technical analysis in forming our view as to the valuation and prospects of an investment. Where relevant we have set out those particular matters we think are important in the above article, but further detail can be found here.
Please note that our article on this investment should not be considered to be a regular publication.
Details of all recommendations issued by ii during the previous 12-month period can be found here.
ii adheres to a strict code of conduct. Contributors may hold shares or have other interests in companies included in these portfolios, which could create a conflict of interests. Contributors intending to write about any financial instruments in which they have an interest are required to disclose such interest to ii and in the article itself. ii will at all times consider whether such interest impairs the objectivity of the recommendation.
In addition, individuals involved in the production of investment articles are subject to a personal account dealing restriction, which prevents them from placing a transaction in the specified instrument(s) for a period before and for five working days after such publication. This is to avoid personal interests conflicting with the interests of the recipients of those investment articles.