Chart of the week: A perfect tramline trade
22nd December 2014 10:25
by John Burford from interactive investor
Share on
By John C Burford, author of Tramline Trading, and editor of MoneyWeek Trader
In these weekly articles, I will highlight a share that I believe has an interesting chart pattern. I am primarily a technical trader and use the methods I have developed that I call Tramline Trading. You can read more about my methods in my book Tramline Trading, which you can inspect here.
Most traders and investors make classic errors by chasing a stock near a top and then hang on to it too long during the decline. You will vastly improve your performance by timing your entries and exits more expertly - and that is what I hope to help you with.
I developed my tramline system over several years to give me a set of rules which can provide me with trade entries at low risk. The low risk requirement was crucially important because no matter how firmly I believe in my trade, I could be wrong! And I wanted my wrong trades to hand me the smallest possible loss to my account. I figured the winners would take care of themselves.
My hope is that you glean useful ideas and employ at least some technical analysis to bolster your returns. In trading as well as investing, timing is a key factor in your eventual returns.
BT dials into the bull trend
Way back in the late 1990s, British Telecom became a fellow-traveller to the hot dotcom stocks within the dotcom bubble and reached the giddy heights of £15.13. This was totally unjustified, of course. After all, was - and is - a giant of the telecoms industry and not a hot start-up, as so many of those bubble stocks were.
Naturally, when the madness of the dotcom bubble burst, BT fell back down to earth and since then, has traded like the solid, dependable widows-and-orphans share it always has been. In fact, the company was having very hard times and the share price reflected that, reaching a low of 71p. How the mighty had fallen!
I often wondered why BT was included in the bubble stock mania - maybe it was because they had a website. But that is the nature of manias - even the most unlikely assets get caught up in the collective madness.
Fast forward to last week and the news that BT wants to buy a major mobile operator has hit the headlines. Like most M&A stories, this one was greeted bullishly. Sadly, it is only later discovered that many mergers do not fulfill their heady promise. Whether this one will is an open question.
But it was the chart that interested me. Here is the daily chart from the 1980s:
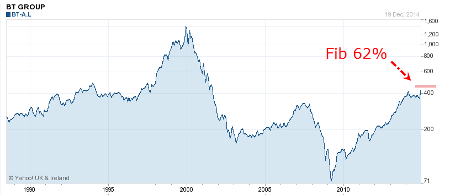
(click to enlarge)
This is a log scale, but note the market is approaching the Fibonacci 62% retrace of the wave down off the 1999 high. This should be heavy resistance if the market makes it that high.
From the 2009 low of 71p, the market has recovered to the recent 400 area.
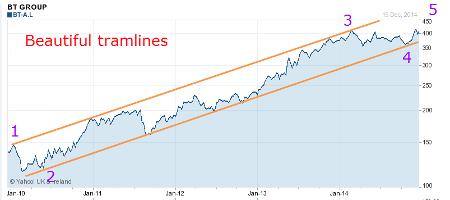
Let's look at the rally off the 2009 low:
(click to enlarge)
The rally is a textbook example of trading along tramlines (see text, pp 22-26, 48-52) where the market has been trading for five years inside the trading channel contained between my parallel tramlines. You really cannot find a much better example of tramlines in action than this.
My third wave is long and strong, as required (see text, pp118-129).
If the market can reach the upper tramline again, that would put my target in the 450 - 500 zone, precisely in the same area as the Fibonacci target above!
To be able to derive the same target area from two independent methods is a bonus of my tramline methods.
Also, I have placed Elliott Wave labels on the rally and if correct, the market is now in the final fifth wave up (see text, pp87-89). When this wave completes, the market will descend in either a large correction or a new bear market.
The key to finding the extent of this fifth wave is to monitor this wave and when there are five sub-waves, that is the time to look for a top.
Here is the latest chart:
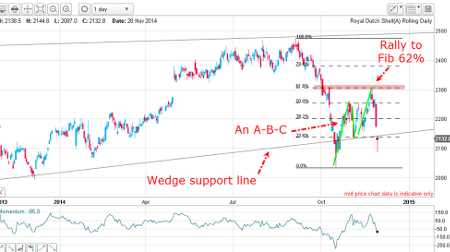
(click to enlarge)
Wave 4 has completed a lovely wedge (see text, pp33-38, 71-80, 152) - a typical fourth wave pattern - and is heading up in the final fifth wave.
Note the pull-back in a kiss to the upper wedge line (see text, pp 82-84) last week and the start of a scalded cat bounce - a very powerful thrusting move.
Above the market, resistance lurks in the 450 - 500 area (see top chart).
And here is a close-up of the latest leg up:
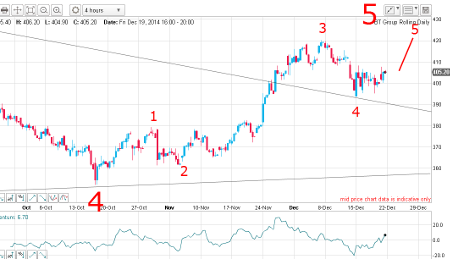
(click to enlarge)
I have an excellent Elliott wave count up off the wave 4 low with the market having kissed the upper wedge line on 15 December and is bouncing up in what should be a scalded cat bounce.
It is widely thought that BT will launch a rights issue to raise the funds for the purchase of the preferred target, EE. Naturally, this could dilute the share price somewhat, depending on the details and investor sentiment.
Outlook
For now the trend remains up, but resistance lurks around the 450 - 500 area. That would be a sensible place to look to take at least some profits off the table, if available.
These articles are provided for information purposes only. Occasionally, an opinion about whether to buy or sell a specific investment may be provided by third parties. The content is not intended to be a personal recommendation to buy or sell any financial instrument or product, or to adopt any investment strategy as it is not provided based on an assessment of your investing knowledge and experience, your financial situation or your investment objectives. The value of your investments, and the income derived from them, may go down as well as up. You may not get back all the money that you invest. The investments referred to in this article may not be suitable for all investors, and if in doubt, an investor should seek advice from a qualified investment adviser.
Full performance can be found on the company or index summary page on the interactive investor website. Simply click on the company's or index name highlighted in the article.
Disclosure
We use a combination of fundamental and technical analysis in forming our view as to the valuation and prospects of an investment. Where relevant we have set out those particular matters we think are important in the above article, but further detail can be found here.
Please note that our article on this investment should not be considered to be a regular publication.
Details of all recommendations issued by ii during the previous 12-month period can be found here.
ii adheres to a strict code of conduct. Contributors may hold shares or have other interests in companies included in these portfolios, which could create a conflict of interests. Contributors intending to write about any financial instruments in which they have an interest are required to disclose such interest to ii and in the article itself. ii will at all times consider whether such interest impairs the objectivity of the recommendation.
In addition, individuals involved in the production of investment articles are subject to a personal account dealing restriction, which prevents them from placing a transaction in the specified instrument(s) for a period before and for five working days after such publication. This is to avoid personal interests conflicting with the interests of the recipients of those investment articles.