Model growth portfolios: Annual review
14th January 2015 10:41
by Helen Pridham from interactive investor
Share on
Our growth portfolios are divided into three categories to reflect investors' different time horizons as well as attitudes to risk. One category is designed for the short term (5-9 years), one for the medium term (10-14 years) and one for the long term (15 years-plus).
With the shorter term portfolios there is a greater emphasis on capital preservation so a more cautious approach has been taken, even with the higher risk version. Due to this approach the returns on the two short-term portfolios over three years have been relatively modest although they did considerably better in 2014 than in previous years.
The more time you have on your side, the more speculative you can be as you have longer to ride out stock market fluctuations. This can result in better short term results but also potential volatility as the returns last year on our higher risk growth portfolios demonstrate.
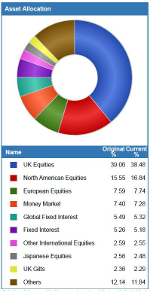
Medium risk growth
Alpha - short term growth
Performance to 1 January 2015:
5.8% over one year, 23.9% over three years.
In 2014 we also switched out of , which had failed to live up to our expectations of being able to perform well when markets were favourable and preserve capital when conditions were poor. In July 2014, we replaced it with , which has shown that it can produce absolute returns since its launch in 2010.
Another disappointing holding has been which we have also decided to replace. Although we like manager Alastair Mundy's contrarian approach, it seems to have worked less well with this fund than with the investment trust he manages. We have therefore decided to replace this holding with the . Capital preservation is an important part of the Lindsell Train approach and we particularly like the company's basic philosophy which is "to run client capital as we would run our own".
Alpha Portfolio three-year performance chart
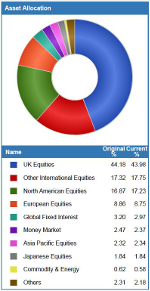
Bravo - medium term growth
Performance to 1 January 2015:
8.7% over one year, 39.1% over three years.
Witan uses a number of external fund managers to run its investments. They are chosen by its chief executive Andrew Bell, who also runs part of the portfolio himself. Since he was appointed in 2010, Witan's performance has improved markedly and since the inception of this portfolio, the trust has gone from a discount of around 10% to a small premium which has also helped to enhance its returns.
Three of the original holdings are no longer in the portfolio. Disappointing performances from , and led to their removal. In October 2013, Troy Spectrum was replaced by Fundsmith Equity which went on to become the portfolio's strongest performer in 2014.
In July 2014, Artemis Strategic Assets was replaced by which had returned around 5% by the end of the year. And in October, Monks was replaced by which has also made a useful contribution to the portfolio's performance within a relatively short time.
Bravo Portfolio three-year performance chart
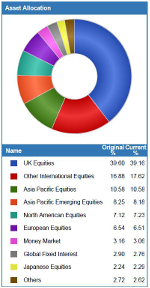
Charlie - longer term growth
Performance to 1 January 2015:
6.9% over one year, 42.3% over three years.
So far there has been only one switch to the portfolio. Due to its disappointing performance Monks was substituted by Ardevora Global Equity in October 2014. We are now making a further switch. is to be replaced by .
Although the Legal & General fund has made good progress over the three years as a whole, its performance has been somewhat more erratic than we had expected. Miton UK Value Opportunities was only set up in March 2013. However, its managers George Godber and Georgina Hamilton, already have a good track record. It is a relatively focused fund so it may also be volatile. But it has got off to a good start and we hope it will serve the portfolio well.
Charlie Portfolio three-year performance chart
Higher risk growth
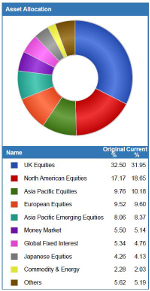
Delta - short term growth
Performance to 1 January 2015:
10.3% over one year, 38.6% over three years.
The biggest boost came from Fundsmith Equity, the only holding which was not in the original line-up. It was brought into the portfolio in October 2013 to replace Troy Spectrum whose performance had proved disappointing. We are delighted that the Fundsmith approach of buying and holding good global companies for the long term has paid off.
Other strong performances over the past year have come from and Witan, which has also contributed most to the portfolio’s three year performance.
We are now making a second change to the portfolio by replacing with accumulation units in . Although we like manager Alastair Munday's contrarian approach, it seems to have worked rather less well with this fund than with the investment trust he manages. Income funds tend to invest in relatively defensive companies and we already hold Rathbone Income in other portfolios.
Delta Portfolio three-year performance chart
Echo - medium term growth
Performance to 1 January 2015:
1.8% over one year, 30.3% over three years.
was the greatest detractor due to a significant decline in the mining sector last year, compounded by having to write-down the value of two of its investments which went wrong. When the trust was added to the portfolio in January 2014, we were anticipating a recovery in commodities as the world economy improved. We were obviously too early but we do not believe that now is the time to sell. We still believe in the expertise of the investment team.
However, we have decided to replace Legal & General UK Alpha with Miton UK Value Opportunities. Legal & General UK Alpha has proved more erratic than we anticipated. While the Miton fund is relatively new, having been set up in March 2013, its managers George Godber and Georgina Hamilton, already have a good track record and we expect it to serve the portfolio well.
Echo Portfolio three-year performance chart
Foxtrot - longer term growth
Performance to 1 January 2015:
2.5% over one year, 43.6% over three years.
The trust suffered from a significant decline in the mining sector last year, compounded by having to write-down the value of two of its investments which went wrong. When the trust was added to the portfolio in January 2014, we were anticipating a recovery in commodities as the world economy improved. We were obviously too early but we do not believe that now is the time to sell. We still believe in the expertise of the investment team.
On the brighter side, the two other switches we made in 2014 replacing with and Monks with Caledonia have been positive for the portfolio's performance. Moreover our holding in , a fund of private equity funds, has continued to deliver extremely good returns over the past year.
Foxtrot Portfolio three-year performance chart
This article is for information and discussion purposes only and does not form a recommendation to invest or otherwise. The value of an investment may fall. The investments referred to in this article may not be suitable for all investors, and if in doubt, an investor should seek advice from a qualified investment adviser.