Chart of the week: Prepare for massive surprise to the upside
19th January 2015 10:21
by John Burford from interactive investor
Share on
By John C Burford, author of Tramline Trading, and editor of MoneyWeek Trader
In these weekly articles, I will highlight a share that I believe has an interesting chart pattern. I am primarily a technical trader and use the methods I have developed that I call Tramline Trading. You can read more about my methods in my book Tramline Trading, which you can inspect here.
Most traders and investors make classic errors by chasing a stock near a top and then hang on to it too long during the decline. You will vastly improve your performance by timing your entries and exits more expertly - and that is what I hope to help you with.
My goal in these articles is to cover a share that has an interesting chart. I I developed my tramline system over several years to give me a set of rules which can provide me with trade entries at low risk. The low risk requirement was crucially important because no matter how firmly I believe in my trade, I could be wrong! And I wanted my wrong trades to hand me the smallest possible loss to my account. I figured the winners would take care of themselves.
My hope is that you glean useful ideas and employ at least some technical analysis to bolster your returns. In trading as well as investing, timing is a key factor in your eventual returns.
Can Anglo American get up off the floor?
is one of the largest mining companies in the world. It produces iron ore, coal, copper and many other minerals and metals vital to industry.
And that is its big problem - prices for these commodities have been plunging across the board.
All of a sudden, pundits have been coming out of the woodwork to "explain" the massive falls in crude oil (over-supply), iron ore (lack of Chinese demand), and copper (over-supply).
But here's the thing: just before the big falls got under way last summer, nobody was forecasting these falls and nobody mentioned over-supply. It was all systems go for the global economies, wasn't it?
China was building like there was no tomorrow and the outlook for the US and UK economies was set fair for the sunny uplands as they basked in ZIRP for ever and unlimited liquidity, courtesy of the central banks.
Deflation is latest market worry
Deflation? A dirty word - and certainly not on anyone's radar then.
But what a difference a few months makes!
Now, as commodities have crashed, deflation is on everyone's lips and has even reached the MSM as the biggest threat to global finance. Everyone's now talking about deflation. It is the lazy person's excuse du jour to explain falling markets.
With today's equivalent of the shoe-shine boy of the 1920s now using the word as if it was always in his vocabulary - although not understanding what deflation actually is -is it time for astute traders to bet the other way?
For the record, I have been warning of deflation for several years when it was considered a crackpot idea. In fact, the utter "impossibility" of deflation was one of the reasons I knew I was on the right track!
Beware of betting with the crowd
When an idea gets embraced by the crowd, it makes me very nervous. As that late great trader Joe Granville once remarked: "When something seems obvious to most, it is obviously wrong"
So I want to propose this share as a contrary play and will back that up with some interesting charts. Here is the first one - the weekly chart going back to 2005:
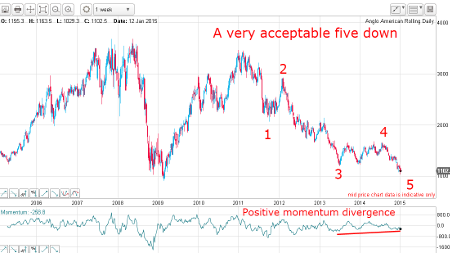
From the January 2011 high at £35, it has been downhill most of the way. I am able to place good Elliott wave labels on this decline with wave 3 in particular being "long and strong" - a typical characteristic of third waves.
And now the market has moved into new low ground near £10 in wave 5. Fifth waves are ending waves. When a fifth wave ends, the trend reverses. That is one of the most useful insights of Elliott wave theory.
And on this weekly chart, there is a powerful positive momentum divergence building. This indicates selling pressure is drying up and could herald a swift reversal of trend soon.
This is a very powerful setup (and is almost identical to that in Fresnillo - see last week's Chart of the Week).
One other feature of the above chart well worth noting: At the £10 area, it has reached previous support at that level from the plunge low in 2009. That is a support area worth noting.
Here is a close-up of the daily chart of recent action within wave 5:
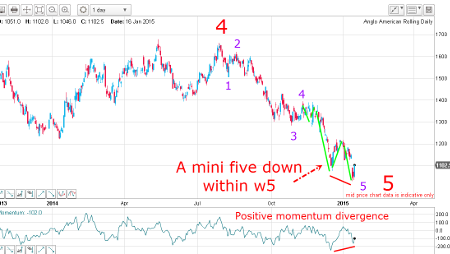
I can set terrific labels of the Elliott waves within the large wave 5 - in fact, they are textbook!
My mini-wave 3 sports its own five-wave pattern, as does wave 5 (purple) as marked in green bars.
And with the positive momentum divergence at the low made last week, the scene is set for a massive surprise to the upside.
The recent quote in US dollars, shows an even steeper fall thanthe quote in pounds sterling, since GBP/USD has lost over 12% since last July and represents an even more bombed-out picture.
It currently pays a 5.18% dividend, but that may be not be safe.
Outlook
If AAL hasn't already made its low, it will soon do so. My first major target is the wave 4 high at the £14 area. If it reaches that, a target at the £16 area looms into view.
Sentiment is off-the-scale bearish towards the company's commodity output, and at least a short squeeze of some magnitude appears likely in the near term.
These articles are provided for information purposes only. Occasionally, an opinion about whether to buy or sell a specific investment may be provided by third parties. The content is not intended to be a personal recommendation to buy or sell any financial instrument or product, or to adopt any investment strategy as it is not provided based on an assessment of your investing knowledge and experience, your financial situation or your investment objectives. The value of your investments, and the income derived from them, may go down as well as up. You may not get back all the money that you invest. The investments referred to in this article may not be suitable for all investors, and if in doubt, an investor should seek advice from a qualified investment adviser.
Full performance can be found on the company or index summary page on the interactive investor website. Simply click on the company's or index name highlighted in the article.
Disclosure
We use a combination of fundamental and technical analysis in forming our view as to the valuation and prospects of an investment. Where relevant we have set out those particular matters we think are important in the above article, but further detail can be found here.
Please note that our article on this investment should not be considered to be a regular publication.
Details of all recommendations issued by ii during the previous 12-month period can be found here.
ii adheres to a strict code of conduct. Contributors may hold shares or have other interests in companies included in these portfolios, which could create a conflict of interests. Contributors intending to write about any financial instruments in which they have an interest are required to disclose such interest to ii and in the article itself. ii will at all times consider whether such interest impairs the objectivity of the recommendation.
In addition, individuals involved in the production of investment articles are subject to a personal account dealing restriction, which prevents them from placing a transaction in the specified instrument(s) for a period before and for five working days after such publication. This is to avoid personal interests conflicting with the interests of the recipients of those investment articles.