Chart of the week: Defensive, but no dullard
23rd March 2015 12:18
by John Burford from interactive investor
Share on
By John C Burford, author of Tramline Trading, and erditor of MoneyWeek Trader
In these weekly articles, I will highlight a share that I believe has an interesting chart pattern. I am primarily a technical trader and use the methods I have developed that I call Tramline Trading. You can read more about my methods in my book Tramline Trading, which you can inspect here.
Most traders and investors make classic errors by chasing a stock near a top and then hang on to it too long during the decline. You will vastly improve your performance by timing your entries and exits more expertly - and that is what I hope to help you with.
My goal in these articles is to cover a share that has an interesting chart. I I developed my tramline system over several years to give me a set of rules which can provide me with trade entries at low risk. The low risk requirement was crucially important because no matter how firmly I believe in my trade, I could be wrong! And I wanted my wrong trades to hand me the smallest possible loss to my account. I figured the winners would take care of themselves.
My hope is that you glean useful ideas and employ at least some technical analysis to bolster your returns. In trading as well as investing, timing is a key factor in your eventual returns.
Scottish and Southern Energy is perking up
is one of the Big Six energy utility suppliers which dominate the energy market in the UK. It is a classic "widows and orphans" investment and is attractive to conservative dividend-seeking investors. But that is not to say it trades as a dullard!
And when the current manic risk-on sentiment of investors subsides, this share should become even more attractive as a safe haven.
But it is the chart that caught my eye - here is the daily chart spanning a couple of years
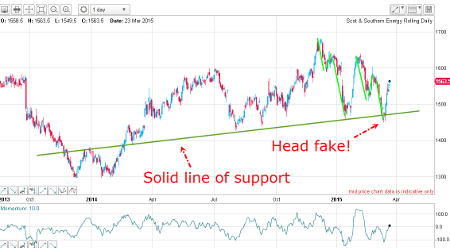
The major feature is the solid line of support dating from the year 2013. This line contains accurate touch points first from the high in December 2013, and then the lows from February 2014 onwards.
Every attempt to break below it has been repulsed - except for the stand-out break and then recovery - in mid-March. This is what I call a head fake.
Mercifully, head fakes are quite rare in a long-standing line of support or resistance. But when they do occur and the market moves quickly back into line, the subsequent move is very often quite sharp. This is indeed occurring over the past few days.
The other feature of the recent action is the three waves down patterns off recent highs (green lines). This kind of action is the hallmark of corrective behaviour, so keeping the main uptrend intact.
So let's examine the short-term action on the hourly chart:
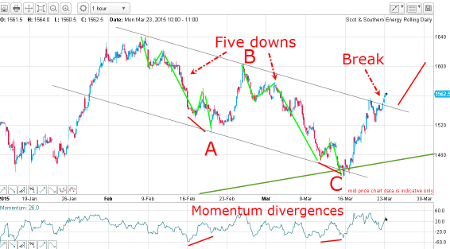
I have a very good down-sloping tramline pair connecting all the major highs and lows. The big pattern is clearly an A-B-C (corrective) and waves A and C both contain five waves down (marked in green). And there are momentum divergences as waves A and C terminate on the lower tramline. This is textbook.
Following last week's head fake on the lower tramline, the market has zoomed up, touched the upper tramline and has today broken above it. Remember, upper tramlines are lines of resistance and when broken, provides a bullish signal.
But this breakout could be another head fake! Here is the recent rally:
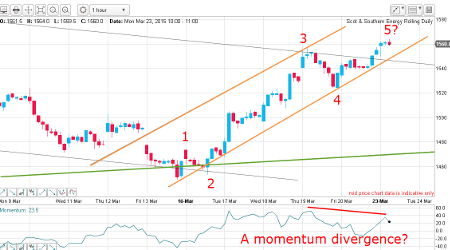
As of this morning, I have a potential complete five up travelling along my brown tramlines with a budding momentum divergence. If this is a near-complete five up, the next move will be down in a corrective pattern - usually an A-B-C form.
Now if the market does retreat from here and push below my lower brown tramline, that would slightly weaken the bullish case and could set up a new head fake!
Outlook
Provided the wave 4 low at the 1,520p level holds, the trend remains up. But a break of that low would indicate the market is in a more complex consolidation phase.
One thing to watch out for is the behaviour of the . It attracted headlines on Friday when it closed at an all-time high over the 7,000 level. But with sentiment towards equities highly elevated, can this move be maintained?
These articles are provided for information purposes only. Occasionally, an opinion about whether to buy or sell a specific investment may be provided by third parties. The content is not intended to be a personal recommendation to buy or sell any financial instrument or product, or to adopt any investment strategy as it is not provided based on an assessment of your investing knowledge and experience, your financial situation or your investment objectives. The value of your investments, and the income derived from them, may go down as well as up. You may not get back all the money that you invest. The investments referred to in this article may not be suitable for all investors, and if in doubt, an investor should seek advice from a qualified investment adviser.
Full performance can be found on the company or index summary page on the interactive investor website. Simply click on the company's or index name highlighted in the article.
Disclosure
We use a combination of fundamental and technical analysis in forming our view as to the valuation and prospects of an investment. Where relevant we have set out those particular matters we think are important in the above article, but further detail can be found here.
Please note that our article on this investment should not be considered to be a regular publication.
Details of all recommendations issued by ii during the previous 12-month period can be found here.
ii adheres to a strict code of conduct. Contributors may hold shares or have other interests in companies included in these portfolios, which could create a conflict of interests. Contributors intending to write about any financial instruments in which they have an interest are required to disclose such interest to ii and in the article itself. ii will at all times consider whether such interest impairs the objectivity of the recommendation.
In addition, individuals involved in the production of investment articles are subject to a personal account dealing restriction, which prevents them from placing a transaction in the specified instrument(s) for a period before and for five working days after such publication. This is to avoid personal interests conflicting with the interests of the recipients of those investment articles.