Chart of the week: An excellent swing trade
30th March 2015 12:43
by John Burford from interactive investor
Share on
By John C Burford, author of of Tramline Trading, and editor of MoneyWeek Trader
In these weekly articles, I will highlight a share that I believe has an interesting chart pattern. I am primarily a technical trader and use the methods I have developed that I call Tramline Trading. You can read more about my methods in my book Tramline Trading, which you can inspect here.
Most traders and investors make classic errors by chasing a stock near a top and then hang on to it too long during the decline. You will vastly improve your performance by timing your entries and exits more expertly - and that is what I hope to help you with.
My goal in these articles is to cover a share that has an interesting chart. I I developed my tramline system over several years to give me a set of rules which can provide me with trade entries at low risk. The low risk requirement was crucially important because no matter how firmly I believe in my trade, I could be wrong! And I wanted my wrong trades to hand me the smallest possible loss to my account. I figured the winners would take care of themselves.
My hope is that you glean useful ideas and employ at least some technical analysis to bolster your returns. In trading as well as investing, timing is a key factor in your eventual returns.
Aberdeen Asset Management is at the point of decision
Last week, I covered and today I will cover . In case you are wondering, I do not have a thing about Scottish companies! It is the charts of these two that are compelling.
ADN is a large investment trust that manages assets that span the globe with the majority in the UK. It is particularly favoured by investors seeking a high dividend yield - currently paying around 4.2%.
The company has just announced it is increasing its exposure to North Asia and also to the USA. Bullish noises are coming from the City, but that should sound a note of caution to traders.
Here is the long-range weekly chart:
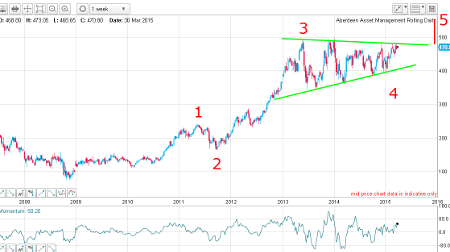
From the credit crunch low of 2008, the market has followed the general market higher and I have marked a valid Elliott wave count. The first major rally was to the wave 1 high. Then, a dip to the wave 2 low and then a long and strong rally phase in wave 3.
Third waves are overwhelmingly long and strong - that is the one sure way to tell if a move is likely to be a third wave. So, with three waves fixed, the market entered a huge consolidation phase which has lasted almost two years.
Basically, the share price has gone nowhere in two years. That must be intensely frustrating for many investors, who have seen other FTSE shares increase in value in that time.
This consolidation is wave 4 - and is entirely typical of a fourth wave. The shape is a wedge (or triangle) with a rising lower support line. The upper line is a line of resistance and the market has been caught between these two lines since early 2013.
The basic rule of a wedge is this: the more time the market trades within it, the sharper the ultimate move out. So, when the market does decide to break out, the move is likely to be fast and furious.
Naturally, the question is this: which way will it break out of the wedge - up or down?
Here is a close up of wave 4:

I have a very solid lower wedge line which has multiple accurate touch points. Remember, the greater the number of accurate touch points on a line, the more reliable is your line of support (or resistance) and the more likely it will remain a line of support (or resistance) for further tests.
I have also drawn in a minor upper tramline (dark green) which has some accurate touch points. This is a solid line of resistance.
But the market is reaching a moment of decision as the wedge apex approaches.
I see the market has two main options. First, it could retreat from here and test the lower wedge line again where it should meet solid support. It should then go on the break above the upper tramline and also break the upper wedge line as it goes on to form wave 5.
The second main option is for the market to drive up straight away and break the upper lines of resistance to form wave 5. And remember, fifth waves are ending waves. When a fifth wave terminates, the trend reverses.
Outlook
Either way, the odds favour a move to new highs in wave 5 above the 500p level.
But beware: this wave 5 should be the final thrust in the over seven year bull market!
This is because fifth waves out of a wedge wave 4 are normally completely reversed very swiftly. This is a trade not to tuck away in the back of your drawer, but should make an excellent swing trade.
These articles are provided for information purposes only. Occasionally, an opinion about whether to buy or sell a specific investment may be provided by third parties. The content is not intended to be a personal recommendation to buy or sell any financial instrument or product, or to adopt any investment strategy as it is not provided based on an assessment of your investing knowledge and experience, your financial situation or your investment objectives. The value of your investments, and the income derived from them, may go down as well as up. You may not get back all the money that you invest. The investments referred to in this article may not be suitable for all investors, and if in doubt, an investor should seek advice from a qualified investment adviser.
Full performance can be found on the company or index summary page on the interactive investor website. Simply click on the company's or index name highlighted in the article.
Disclosure
We use a combination of fundamental and technical analysis in forming our view as to the valuation and prospects of an investment. Where relevant we have set out those particular matters we think are important in the above article, but further detail can be found here.
Please note that our article on this investment should not be considered to be a regular publication.
Details of all recommendations issued by ii during the previous 12-month period can be found here.
ii adheres to a strict code of conduct. Contributors may hold shares or have other interests in companies included in these portfolios, which could create a conflict of interests. Contributors intending to write about any financial instruments in which they have an interest are required to disclose such interest to ii and in the article itself. ii will at all times consider whether such interest impairs the objectivity of the recommendation.
In addition, individuals involved in the production of investment articles are subject to a personal account dealing restriction, which prevents them from placing a transaction in the specified instrument(s) for a period before and for five working days after such publication. This is to avoid personal interests conflicting with the interests of the recipients of those investment articles.