Chart of the week: A highly reliable and very powerful pattern
20th April 2015 13:46
by John Burford from interactive investor
Share on
By John C Burford, author of Tramline Trading, and aditor of MoneyWeek Trader
In these weekly articles, I will highlight a share that I believe has an interesting chart pattern. I am primarily a technical trader and use the methods I have developed that I call Tramline Trading. You can read more about my methods in my book Tramline Trading, which you can inspect here.
Most traders and investors make classic errors by chasing a stock near a top and then hang on to it too long during the decline. You will vastly improve your performance by timing your entries and exits more expertly - and that is what I hope to help you with.
My goal in these articles is to cover a share that has an interesting chart. I I developed my tramline system over several years to give me a set of rules which can provide me with trade entries at low risk. The low risk requirement was crucially important because no matter how firmly I believe in my trade, I could be wrong! And I wanted my wrong trades to hand me the smallest possible loss to my account. I figured the winners would take care of themselves.
My hope is that you glean useful ideas and employ at least some technical analysis to bolster your returns. In trading as well as investing, timing is a key factor in your eventual returns.
Update on Ashtead Group
Last week, I had a super trade setup with this chart:
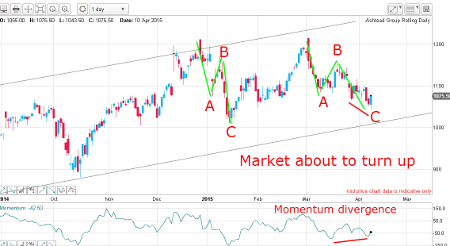
I had two textbook A-B-C patterns (which are corrective, indicating the bull trend was intact). This is what I wrote then: "As I write, the market appears to be completing the C wave - and on a positive momentum divergence (red bars). Remember, a momentum divergence is showing that selling is getting weaker than it was on the A wave and usually heralds a turn."
And immediately after that post, the market did indeed bounce off that C wave low and is trading 70p higher as I write:
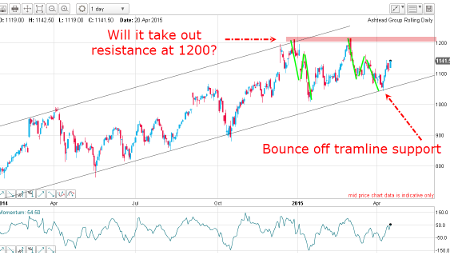
The bull run can be maintained with a break above previous resistance at the 1200 level. Only a decline below the lower tramline would put the bull case in jeopardy. So long trades from last week can be protected by placing a close stop just below this lower tramline.
Petrofac is in trouble
is a major oilfield services group that has had a string of bad luck. It issued a profits warning last November on the back of delays and extra costs with one of its projects and, just today, has said it will take a massive hit on its gas venture in the Shetlands, which has been bedeviled by strikes and a subcontractor dispute.
Normally, such bearish news would send me scurrying to find a low in the shares just on a simple contrarian approach (my specialty!). So let's look at the charts and see if there is a bullish trade or whether the bear trend appears intact. Here is the daily chart:
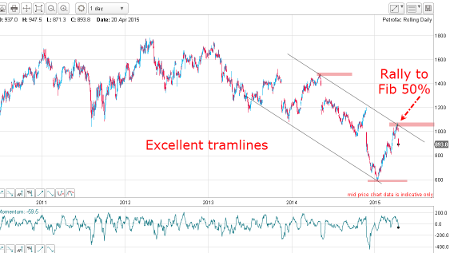
I have an excellent tramline pair and the market rallied last week to the upper tramline, which is always resistance. In addition, the rally to just above 1,000p was a 50% Fibonacci retrace of the previous wave down. This is also a resistance level.
So, with two levels of resistance at the 1000 area reinforcing each other, the market did what was expected; it declined this morning - and with force (it is currently down over £1 as I write).
In fact, this retreat off the 1000 level is a textbook example of how, by combining the use of my tramline system with a simple application of Fibonacci principles, you can pinpoint in advance a likely turning point and where a trade can be put on.
In this case, a short trade at the 1000 area was the textbook trade.
But let's examine the short-term chart for more information:
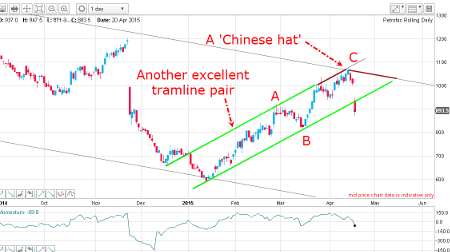
The rally from January is contained within the trading channel described by my excellent rising tramline pair (in green). And when the market (and the upper green tramline) hit the descending major upper tramline, that was also major resistance. Such a meeting of tramlines I call a Chinese Hat - and the most likely outcome is a sharp repulse out of it.
The Chinese Hat is a very powerful pattern and I look for them constantly as a highly reliable sign that the market is about to turn and where a low risk trade can be entered.
And that is what we are seeing this morning with the market now having broken the lower tramline, which is bearish.
Outlook
I am unable to make a case for taking a contrarian position here. Although I am in general looking for market turns, which are necessarily contrarian, I do not like to stand in front of a steamroller.
Unless the market catches a bid and moves above the 1000 level soon - which I do not anticipate - it appears the trend remains down.
And it is entirely possible that the 600p low will be challenged in the near future.
These articles are provided for information purposes only. Occasionally, an opinion about whether to buy or sell a specific investment may be provided by third parties. The content is not intended to be a personal recommendation to buy or sell any financial instrument or product, or to adopt any investment strategy as it is not provided based on an assessment of your investing knowledge and experience, your financial situation or your investment objectives. The value of your investments, and the income derived from them, may go down as well as up. You may not get back all the money that you invest. The investments referred to in this article may not be suitable for all investors, and if in doubt, an investor should seek advice from a qualified investment adviser.
Full performance can be found on the company or index summary page on the interactive investor website. Simply click on the company's or index name highlighted in the article.
Disclosure
We use a combination of fundamental and technical analysis in forming our view as to the valuation and prospects of an investment. Where relevant we have set out those particular matters we think are important in the above article, but further detail can be found here.
Please note that our article on this investment should not be considered to be a regular publication.
Details of all recommendations issued by ii during the previous 12-month period can be found here.
ii adheres to a strict code of conduct. Contributors may hold shares or have other interests in companies included in these portfolios, which could create a conflict of interests. Contributors intending to write about any financial instruments in which they have an interest are required to disclose such interest to ii and in the article itself. ii will at all times consider whether such interest impairs the objectivity of the recommendation.
In addition, individuals involved in the production of investment articles are subject to a personal account dealing restriction, which prevents them from placing a transaction in the specified instrument(s) for a period before and for five working days after such publication. This is to avoid personal interests conflicting with the interests of the recipients of those investment articles.