Chart of the week: This share is heading one way
29th June 2015 13:14
by John Burford from interactive investor
Share on
By John C Burford, author of Tramline Trading, and Editor of MoneyWeek Trader
In these weekly articles, I will highlight a share that I believe has an interesting chart pattern. I am primarily a technical trader and use the methods I have developed that I call Tramline Trading. You can read more about my methods in my book Tramline Trading, which you can inspect here.
Most traders and investors make classic errors by chasing a stock near a top and then hang on to it too long during the decline. You will vastly improve your performance by timing your entries and exits more expertly - and that is what I hope to help you with.
My goal in these articles is to cover a share that has an interesting chart. I I developed my tramline system over several years to give me a set of rules which can provide me with trade entries at low risk. The low risk requirement was crucially important because no matter how firmly I believe in my trade, I could be wrong! And I wanted my wrong trades to hand me the smallest possible loss to my account. I figured the winners would take care of themselves.
My hope is that you glean useful ideas and employ at least some technical analysis to bolster your returns. In trading as well as investing, timing is a key factor in your eventual returns.
Schroders is backing off
is a long-established asset management company and a major component of the FTSE 100 index. Its fortunes wax and wane with the general conditions of asset markets. When conditions are bullish, assets are accumulated and the company prospers but if conditions become bearish, it will become difficult for asset managers to grow their businesses.
Stockmarkets have been in a bull phase now for over six years and Schroder's share price has appreciated along with the market.
But today, markets have been hit hard by developments in Greece, so my question is this: is the bull market about to turn? If so, then I need to start looking for signs of a turn from the charts.
Here is the daily chart since mid-2014 and it is showing several classic chart features that historically have helped forecast market direction. In fact, this chart is a great textbook example of how I analyse markets using my tramline methods:
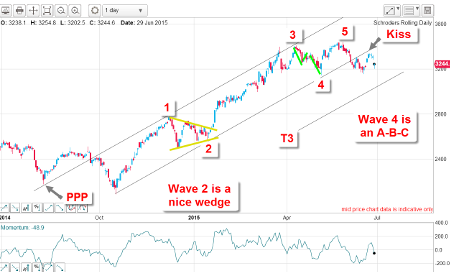
(click to enlarge)
From the October low at the £22 level, the market staged a vigorous rally inside the trading channel described by my tramline pair. My upper tramline sports a nice PPP (Prior Pivot Point), and several accurate touch points roughly equally-spaced along its length. This feature makes this line a very solid line of resistance.
The lower tramline also possesses three accurate touch points, making it a highly reliable line of support. That is, it was support until the market broke below that line earlier this month. That break transformed the line into a line of resistance.
Market kisses my tramline
And when the market rallied back to the line, it was unable to move above it and simply planted a textbook kiss on the underside of the line (resistance) and is currently backing away down from it in what I call a scalded cat bounce.
With the break of the lower tramline, I am now able to draw in my third tramline T3, which now becomes a major target. The market is now trading in the trading channel between the centre tramline and T3 and will continue to do so until one of the lines is broken.
Also, the rally off the October low has taken place in a very clear Elliott wave motive five up. Wave 2 takes the shape of a wedge with the low making a hit on the Fibonacci 38% retrace of wave 1.
From there, the market rallied in a long and strong wave 3, as is typical. The corrective wave 4 has a typical A-B-C form and wave 5 pushed slightly into new highs before topping.
This is a complete five up and, according to Elliott, we can expect a corrective move in the opposite direction (down).
Here is a close-up of recent action:
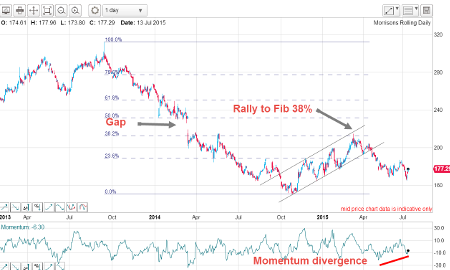
(click to enlarge)
The rally to the kiss also took the market to the Fibonacci 62% retrace of the move down off the wave 5 high, which is a very common turning point for retracements of the first wave off a major high.
Outlook
So now, we have very clear evidence that the market has started a downtrend off the 26 May high at the £34 level. To reverse this trend would take a monumental push in the general market, which appears unlikely.
The path of least resistance is now down and if market can break below the zone of chart support marked in pink:
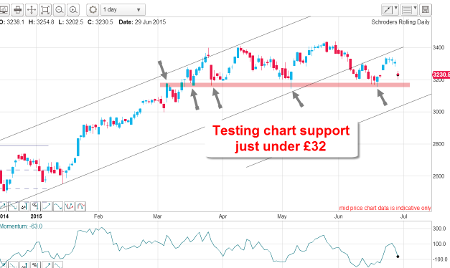
(click to enlarge)
My first target at T3 is within reach.
These articles are provided for information purposes only. Occasionally, an opinion about whether to buy or sell a specific investment may be provided by third parties. The content is not intended to be a personal recommendation to buy or sell any financial instrument or product, or to adopt any investment strategy as it is not provided based on an assessment of your investing knowledge and experience, your financial situation or your investment objectives. The value of your investments, and the income derived from them, may go down as well as up. You may not get back all the money that you invest. The investments referred to in this article may not be suitable for all investors, and if in doubt, an investor should seek advice from a qualified investment adviser.
Full performance can be found on the company or index summary page on the interactive investor website. Simply click on the company's or index name highlighted in the article.
Disclosure
We use a combination of fundamental and technical analysis in forming our view as to the valuation and prospects of an investment. Where relevant we have set out those particular matters we think are important in the above article, but further detail can be found here.
Please note that our article on this investment should not be considered to be a regular publication.
Details of all recommendations issued by ii during the previous 12-month period can be found here.
ii adheres to a strict code of conduct. Contributors may hold shares or have other interests in companies included in these portfolios, which could create a conflict of interests. Contributors intending to write about any financial instruments in which they have an interest are required to disclose such interest to ii and in the article itself. ii will at all times consider whether such interest impairs the objectivity of the recommendation.
In addition, individuals involved in the production of investment articles are subject to a personal account dealing restriction, which prevents them from placing a transaction in the specified instrument(s) for a period before and for five working days after such publication. This is to avoid personal interests conflicting with the interests of the recipients of those investment articles.