Chart of the week: Judgement day for this bank
27th July 2015 12:56
by John Burford from interactive investor
Share on
By John C Burford, author of Tramline Trading, and editor of MoneyWeek Trader
In these weekly articles, I will highlight a share that I believe has an interesting chart pattern. I am primarily a technical trader and use the methods I have developed that I call Tramline Trading. You can read more about my methods in my book Tramline Trading, which you can inspect here.
Most traders and investors make classic errors by chasing a stock near a top and then hang on to it too long during the decline. You will vastly improve your performance by timing your entries and exits more expertly - and that is what I hope to help you with.
My goal in these articles is to cover a share that has an interesting chart. I developed my tramline system over several years to give me a set of rules which can provide me with trade entries at low risk. The low risk requirement was crucially important because no matter how firmly I believe in my trade, I could be wrong! And I wanted my wrong trades to hand me the smallest possible loss to my account. I figured the winners would take care of themselves.
My hope is that you glean useful ideas and employ at least some technical analysis to bolster your returns. In trading as well as investing, timing is a key factor in your eventual returns.
Update on Schroders
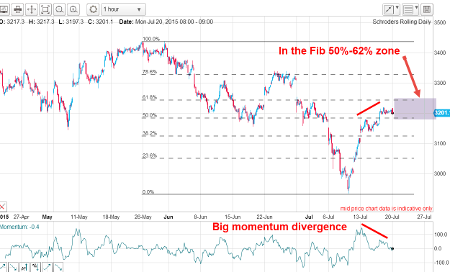
Last week, I noted a very high probability trade set-up where the market had rallied out of a steep downtrend to the Fibonacci 50% - 62% resistance zone. This is what I wrote: "The relief rally has carried into the Fibonacci 50% - 62% zone from where reversals are commonly made. There is also lurking a huge momentum divergence into this zone. Odds are high that a downside reversal can occur at any time."
(click to enlarge)
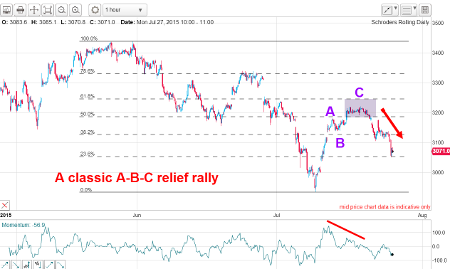
That was the chart I posted last Monday, and here is today's updated hourly chart:
(click to enlarge)
Recall, I noted the negative momentum divergence at the C wave high - a sure give-away that the rally was losing a lot of steam. I find this combination of a clear three-wave counter-trend rally with weakening momentum going into the third wave is a great set-up for winning short trades (and vice versa for long trades). I cover how you can use this simple but effective technique in my book, Tramline Trading.
And this morning, a short trade taken near the 3,200p level last week is in good profit already. And that trade can now be protected by moving the protective stop to break even, thus guaranteeing the trade will not produce a loss in case the market suddenly reverses.
Whither Barclays?
I have been a keen follower of since the dark days of the credit crunch in 2008/2009. It was one of the leading banks that operated its own trading desks in what is known as proprietary (prop) trading where the bank trades its own capital rather than act as middleman for clients. That is what got many other banks into monumental trouble last time - and famously had to be rescued by taxpayers.
I have had one simple rule with banks and their declared profits - they are largely in the eye of the accountants. In other words, profits can be counted in a wide variety of ways and one of the ways is to put a number on the reserves needed to cover possible bad debts. That number can almost be plucked from thin air.
But when the economy is doing well and loans are being secured, banks do well and the share price generally improves. But with government interference (aka regulations) rapidly on the increase, areas of profit that were available are now closing - and prop trading is one of them.
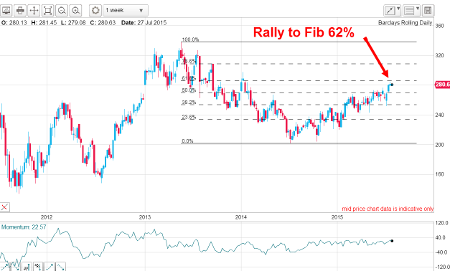
But what is intriguing to me is the long-range chart:
(click to enlarge)
This is the weekly chart going back to 2011. The market made its high in 2013 at the 338p level and had declined to the 200p level one year ago. Since then it's been in rally mode. But the rally has just reached the Fibonacci 62% level - a very common turning point.
The question arises: has Barclays made a turn back down now it has hit that level?
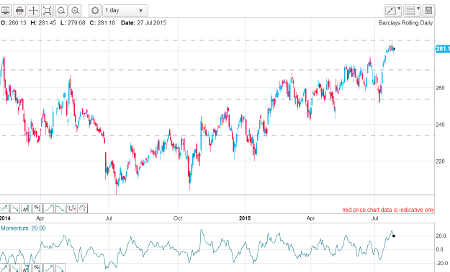
Here is the action over the past year on the daily chart:
(click to enlarge)
The relief rally clearly has a very zig-zag appearance with many highly over-lapping waves. This is typical of a correction, not an impulse pattern. The odds are at some point that the market will be turning back down and resuming the bear trend.
Time to look at the short-term action. Here is the hourly chart:
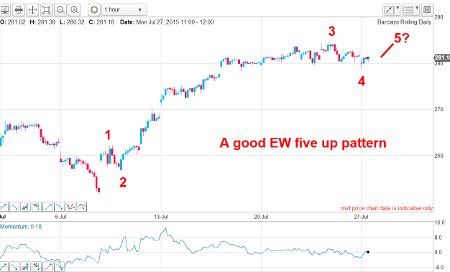
(click to enlarge)
This shows the rally off the early July low with my suggested Elliott wave labels. The strong upthrust is clearly a third wave and my wave 4 is a three-wave A-B-C which is typical of fourth waves.
This scenario calls for a new high in wave 5 up ahead. But that should be the end of the entire rally.
Outlook
With the market into the strong Fibonacci 62% resistance zone, any fifth wave rally would likely be short and lead to a rapid decline. That would set up a short trade.
The alternative is that the market breaks below my wave 4 low before making a new rally high, and in that case, the odds would favour a resumption of the downtrend.
These articles are provided for information purposes only. Occasionally, an opinion about whether to buy or sell a specific investment may be provided by third parties. The content is not intended to be a personal recommendation to buy or sell any financial instrument or product, or to adopt any investment strategy as it is not provided based on an assessment of your investing knowledge and experience, your financial situation or your investment objectives. The value of your investments, and the income derived from them, may go down as well as up. You may not get back all the money that you invest. The investments referred to in this article may not be suitable for all investors, and if in doubt, an investor should seek advice from a qualified investment adviser.
Full performance can be found on the company or index summary page on the interactive investor website. Simply click on the company's or index name highlighted in the article.
Disclosure
We use a combination of fundamental and technical analysis in forming our view as to the valuation and prospects of an investment. Where relevant we have set out those particular matters we think are important in the above article, but further detail can be found here.
Please note that our article on this investment should not be considered to be a regular publication.
Details of all recommendations issued by ii during the previous 12-month period can be found here.
ii adheres to a strict code of conduct. Contributors may hold shares or have other interests in companies included in these portfolios, which could create a conflict of interests. Contributors intending to write about any financial instruments in which they have an interest are required to disclose such interest to ii and in the article itself. ii will at all times consider whether such interest impairs the objectivity of the recommendation.
In addition, individuals involved in the production of investment articles are subject to a personal account dealing restriction, which prevents them from placing a transaction in the specified instrument(s) for a period before and for five working days after such publication. This is to avoid personal interests conflicting with the interests of the recipients of those investment articles.