Chart of the week: Chance for late-comers to join commodities rally
12th October 2015 12:48
By John C Burford, author of Tramline Trading, and editor of MoneyWeek Trader
In these weekly articles, I will highlight shares that I believe have an interesting chart pattern. I am primarily a technical trader and use the methods I have developed that I call Tramline Trading. You can read more about my methods in my book Tramline Trading, which you can inspect here.
Most traders and investors make classic errors by chasing a stock near a top and then hang on to it too long during the decline. You will vastly improve your performance by timing your entries and exits more expertly - and that is what I hope to help you with.
My goal in these articles is to cover a share that has an interesting chart. I developed my tramline system over several years to give me a set of rules which can provide me with trade entries at low risk. The low risk requirement was crucially important because no matter how firmly I believe in my trade, I could be wrong! And I wanted my wrong trades to hand me the smallest possible loss to my account. I figured the winners would take care of themselves.
My hope is that you glean useful ideas and employ at least some technical analysis to bolster your returns. In trading as well as investing, timing is a key factor in your eventual returns.
Update on Royal Dutch Shell
All of a sudden this month, commodity shares have woken up – and I was ready! Along with the rally in US crude oil from $38 in late August to $50 today, gold up from $1,080 in August to $1,165 today and silver up from $14 in August to $16 today, commodity shares have rallied hard.
Today, I will update two shares I have been covering and a new one.
Last week, I had at the start of an uptrend as crude oil prices started to recover. Since then, US crude has topped $50 and Shell has zoomed higher, as forecast.
This was the chart I showed last week:
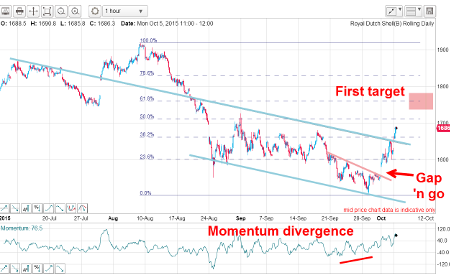
(Click to enlarge)
The market had just punched up past my upper blue tramline following a gap 'n go pattern. This is about as bullish a setup as you will see.
And this is the hourly chart this morning:
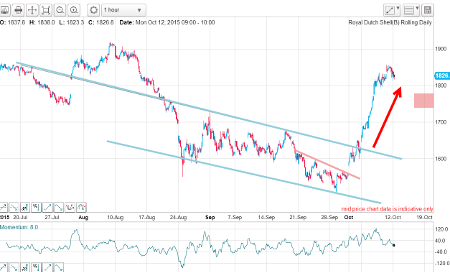
(Click to enlarge)
The buying pressure was so strong that the market blew past my first target in the £17.80 area without pausing for breath. That action confirmed my initial forecast for a very powerful jump.
But today, has the rally carried a little too far and too fast? Momentum on the daily chart is in the 'overbought' range:
(Click to enlarge)
And there is overhead resistance. Also, I have a lovely tramline pair on the daily and the market has just hit the upper line, which represents additional resistance.
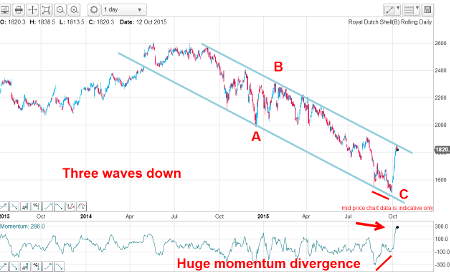
The other point is that the entire move down off the summer highs is in an A-B-C three-wave form. This implies the next big move will be up.
So for short-term traders, the current £18.20 print represents a good area to take at least partial profits. And with crude oil testing the round-number $50 level, I can make a great case for taking at least some profits off the table.
Update on Fresnillo
This is the silver producer I covered a few weeks ago and here is the current daily chart:
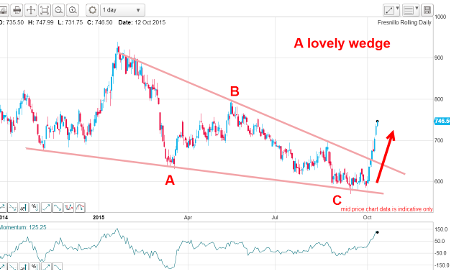
(Click to enlarge)
The decline off the January highs is in the form of an A-B-C which is contained within a wedge (or triangle) pattern. And when the market broke above the upper wedge line last Tuesday, the breakout was very sharp, as befits a genuine breakout from a declining wedge pattern.
So, with the rally confirmed, my main target for is the start of the wedge – at the January highs in the 900p area. But my immediate target is the B wave high at 800p.
Rio Tinto also runs into resistance here
Also taking part in the general commodity rally is :
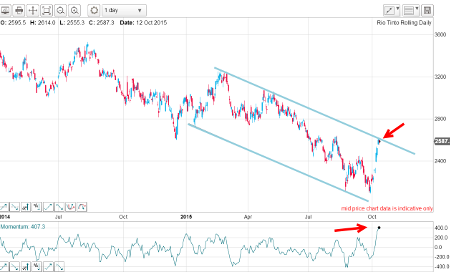
(Click to enlarge)
The charts of the commodity producers have followed along similar lines with the lows being made in August/September and October seeing very sharp rallies.
The market has also hit my upper tramline on an 'overbought' momentum reading (see the Shell chart above).
OUTLOOK
With many commodity shares in a similar temporarily overbought situation, odds favour at least a pause for breath around current values before they make another assault on the tramline resistance.
I expect dips over the next few days which should offer late-comers an opportunity to position long. The current rally in commodities has much more to run.
This article is for information and discussion purposes only and does not form a recommendation to invest or otherwise. The value of an investment may fall. The investments referred to in this article may not be suitable for all investors, and if in doubt, an investor should seek advice from a qualified investment adviser.
These articles are provided for information purposes only. Occasionally, an opinion about whether to buy or sell a specific investment may be provided by third parties. The content is not intended to be a personal recommendation to buy or sell any financial instrument or product, or to adopt any investment strategy as it is not provided based on an assessment of your investing knowledge and experience, your financial situation or your investment objectives. The value of your investments, and the income derived from them, may go down as well as up. You may not get back all the money that you invest. The investments referred to in this article may not be suitable for all investors, and if in doubt, an investor should seek advice from a qualified investment adviser.
Full performance can be found on the company or index summary page on the interactive investor website. Simply click on the company's or index name highlighted in the article.
Disclosure
We use a combination of fundamental and technical analysis in forming our view as to the valuation and prospects of an investment. Where relevant we have set out those particular matters we think are important in the above article, but further detail can be found here.
Please note that our article on this investment should not be considered to be a regular publication.
Details of all recommendations issued by ii during the previous 12-month period can be found here.
ii adheres to a strict code of conduct. Contributors may hold shares or have other interests in companies included in these portfolios, which could create a conflict of interests. Contributors intending to write about any financial instruments in which they have an interest are required to disclose such interest to ii and in the article itself. ii will at all times consider whether such interest impairs the objectivity of the recommendation.
In addition, individuals involved in the production of investment articles are subject to a personal account dealing restriction, which prevents them from placing a transaction in the specified instrument(s) for a period before and for five working days after such publication. This is to avoid personal interests conflicting with the interests of the recipients of those investment articles.
Editor's Picks