Chart of the week: Time to buy these two losers?
23rd November 2015 10:26
by John Burford from interactive investor
Share on
Today, I will update my coverage of and because both have arrived at important price points on their charts.
Update on Pearson - is it a buy now?
I have been extremely bearish on this share ever since I started covering it in May. In my latest update of 26 October, I wrote: "This is one sick puppy. Naturally, relief rallies are likely in the coming days/weeks, but the trend remains firmly down."
The shares have been in free-fall, but there comes a time to buy and a time to sell - could this be a time to buy it?
This was the chart I showed back in October:
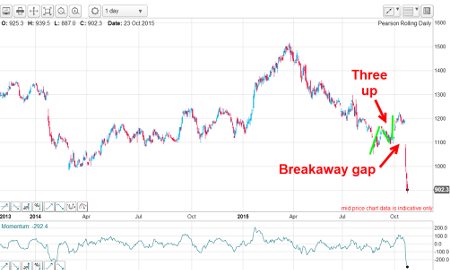
(click to enlarge)
There was an A-B-C counter-trend relief rally in September, but a profit warning slammed the shares with a breakaway gap forming and the shares lost a further £3 (or a mammoth 25%) in just a few days.
And since then, the market has plunged even further - and has fulfilled my definition of a "sick puppy". As the shares have now lost a magnificent 50% since the March top, is a relief rally now due?
After all, according to my Fibonacci rules, the 50% correction is a very common level for the market to turn back. Let's take a look.
Here is the updated chart:
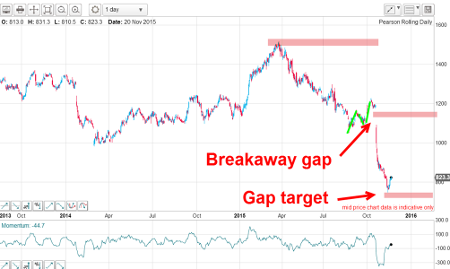
(click to enlarge)
One chartist's rule I observe is that a breakaway gap - and this one is a doozy - usually divides a major wave in half. In other words, it lies about half-way along a major trend. That puts my measured gap target near the recent low at the 760p level.
So now I have two independent targets; one based on the Fibonacci 50% retrace and the other based on the breakaway gap rule. Having two independent measures rather than one greatly strengthens the case for a low around here.
Outlook
Short trades taken in May when I started covering Pearson where the shares traded at the 1,300p-plus area could be covered near here at the 820p level for a profit of a superb 480 major points. And for investors who held the shares and sold in May (and went away), that was a great decision! You can buy them now at half price if you so wish.
This is a great example of how an investor, with a little technical knowledge, can massively increase your results over and above the usual mindless buy-and-hold approach. I have never advocated the latter, simply because who is smart (or lucky) enough to be able to forecast a company's performance a year, two years, ten years hence? It is tough enough making a forecast for next week!
Most investors in Pearson believed the company's prospects were terrific back in the summer. Who can tell when new and better entrants to the sector, or another financial crisis, will emerge to knock the shares for six?
Update on Glencore - a great profit taken
This is a company that has few friends with commodity prices in a severe bear trend. But, as I pointed out in my latest coverage on 19 October, there is a time when, even if a market is in free-fall, a counter-trend rally is due - and a trading opportunity is presented.
This was the chart I showed in October:
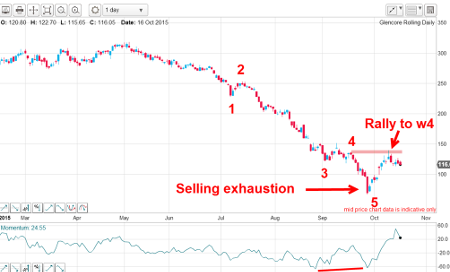
(click to enlarge)
The selling exhaustion on 28 September to the 67p low was the fifth wave low of my five-down off the April 300p high. That was one bear attack! And in fact, it represented a decline of a Fibonacci 78% - and this is one of the major support levels (along with the 50% and 62% levels, which are more common).
So the collapse to the Fibonacci 78% support level in wave 5 and on a positive momentum divergence makes the 67p level a highly likely low leading to a relief rally, which occurred.
The rally carried to the 140p area and this is what I wrote on 19 October: "...since then, the market has doubled and roared back to the 140 high - and note that this was the level of the wave 4 high.
"This was the short squeeze I had forecast. In fact, fourth wave extremes are very often targets for counter-trend rallies - and this one is a classic example.
"With that knowledge, long trades taken within the fifth wave down could be exited at or near the wave 4 high at 140 level for a tidy profit."
And since then, the market has retreated and justified taking profits earlier. But my first Elliott wave label was only one interpretation. I have a valid alternative - and here is the latest chart with my alternate labels:
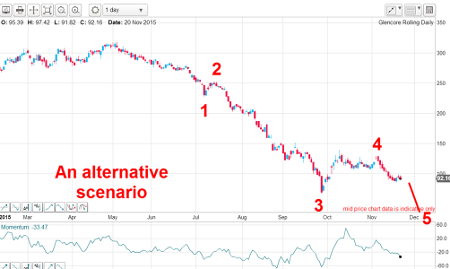
(click to enlarge)
Now, the September plunge low is my wave 3, the rally to the 140 area my wave 4 and wave 5 awaits in a new low below 67p.
But because profits on long trades were taken at the 140 level, I am happy to observe the action for now. If the market does make new lows, that will be the final wave 5 and I shall be looking to go long for a very substantial rally.
But if the rally starts from near here, the formation since August could be a Head and Shoulders pattern - a formidable reversal pattern - and would look like this:
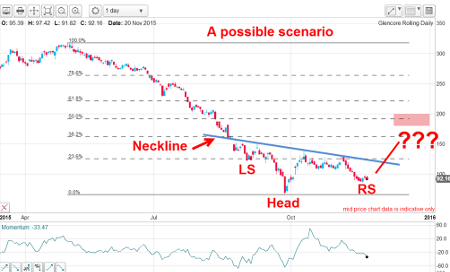
(click to enlarge)
A break up past the blue neckline would greatly help confirm this scenario - and even a normal Fibonacci 50% retrace would send the shares up towards the 200p area for another huge profit.
Outlook
My bottom line is this: if the market can push soon past my neckline, that is my signal to go long. But if it continues its downtrend to new lows, I shall be looking to confirm the fifth wave low and prepare to buy. Meanwhile, the downtrend remains intact.
This article is for information and discussion purposes only and does not form a recommendation to invest or otherwise. The value of an investment may fall. The investments referred to in this article may not be suitable for all investors, and if in doubt, an investor should seek advice from a qualified investment adviser.
These articles are provided for information purposes only. Occasionally, an opinion about whether to buy or sell a specific investment may be provided by third parties. The content is not intended to be a personal recommendation to buy or sell any financial instrument or product, or to adopt any investment strategy as it is not provided based on an assessment of your investing knowledge and experience, your financial situation or your investment objectives. The value of your investments, and the income derived from them, may go down as well as up. You may not get back all the money that you invest. The investments referred to in this article may not be suitable for all investors, and if in doubt, an investor should seek advice from a qualified investment adviser.
Full performance can be found on the company or index summary page on the interactive investor website. Simply click on the company's or index name highlighted in the article.
Disclosure
We use a combination of fundamental and technical analysis in forming our view as to the valuation and prospects of an investment. Where relevant we have set out those particular matters we think are important in the above article, but further detail can be found here.
Please note that our article on this investment should not be considered to be a regular publication.
Details of all recommendations issued by ii during the previous 12-month period can be found here.
ii adheres to a strict code of conduct. Contributors may hold shares or have other interests in companies included in these portfolios, which could create a conflict of interests. Contributors intending to write about any financial instruments in which they have an interest are required to disclose such interest to ii and in the article itself. ii will at all times consider whether such interest impairs the objectivity of the recommendation.
In addition, individuals involved in the production of investment articles are subject to a personal account dealing restriction, which prevents them from placing a transaction in the specified instrument(s) for a period before and for five working days after such publication. This is to avoid personal interests conflicting with the interests of the recipients of those investment articles.