FTSE 100 chart breakout approaches
25th November 2015 14:25
by Lee Wild from interactive investor
Share on
Wall Street traders will have one eye on the turkey Wednesday, and many will likely wrap up business early as they head off for Thanksgiving celebrations tomorrow. Don't expect them back at their desks Friday, either. That means a quiet couple of days for markets elsewhere, and may have implications for our own major indices.
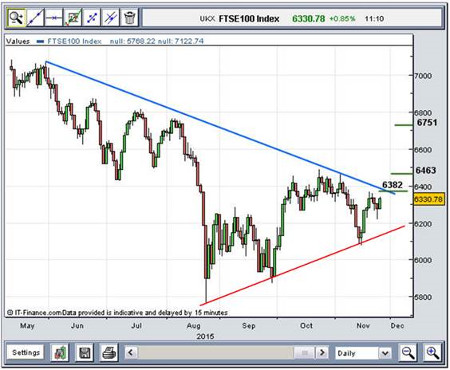
A look at the daily chart reveals a wedge pattern. An uptrend beginning at the August low of 5,768 currently points to technical support at around 6,140. A downward trend line traced back to late May indicates resistance at just under 6,400.
Given the next few days are likely to be quiet, there's a strong likelihood that, barring any shocks, this wedge will continue to develop. At some point, however, there will be a breakout. But which way?
The prospect of a Santa rally is something we've followed closely over the past few weeks. A conversation with chartist Alistair Strang a fortnight ago suggested a high of 6,800 was achievable.
And last week, Alistair came up with a new set of numbers which implied that the rally was still on.
(click to enlarge)
Now, with chancellor George Osborne's hour-long Autumn Statement over, the FTSE 100 is at 6,341 and fast approaching that line of resistance (see blue line on chart above). We've been in touch with Alistair for an update. Here's what he thinks:
About the worst thing possible for the FTSE is it finishing today hard against the downtrend line; it implies a recoil is possible. However, when the US shuts for Thanksgiving, the UK often enjoys quite a good day.
Of course, even if the index betters 6,382 by making a lunge toward my secondary of 6,463, the rally could unwind later in the session to ensure global markets are in sync when Black Friday dawns. That said, for some reason, a frenzied retail shopping day tends to resonate on the stockmarket.
If this is indeed the case, there's a good chance the UK will start trading above the BLUE line (see chart above), in a zone which proposes a longer term 6,782 or so. That would be the Santa rally!
This article is for information and discussion purposes only and does not form a recommendation to invest or otherwise. The value of an investment may fall. The investments referred to in this article may not be suitable for all investors, and if in doubt, an investor should seek advice from a qualified investment adviser.