Chart of the week: Most bullish signal for this share
8th February 2016 13:09
by John Burford from interactive investor
Share on
With commodities, and especially the precious and also base metals now in the rally modes - something I have been flagging for a long time - the massed ranks of short sellers are being mightily squeezed.
For a trader, this is manna from heaven. It gives as much pleasure (and profit) as does panic selling in a phase of long liquidation from over-bought levels (see the FANG stocks - , , and (now Alphabet)).
We have that wonderful combination of metals and miners in a strong rally leg and a general stockmarket in a strong bearish phase. Nimble traders/investors saw this coming and are positioned long miners - or short FANG and many other shares.
Today I will update two miners with very different outlooks, as well as - shares that I have been covering since last year.
Update on Fresnillo
This silver mining company lies below the radar for many investors - but I made a case last year for it to be right up there on your 'buy' list. Today, I have even more reason to do so because the chart has formed a magnificent wedge.
Recall, I love wedges - and so should you! I have pointed out the superb wedge many times - and that pattern has allowed me to forecast the current bear phase. Here is the wedge:
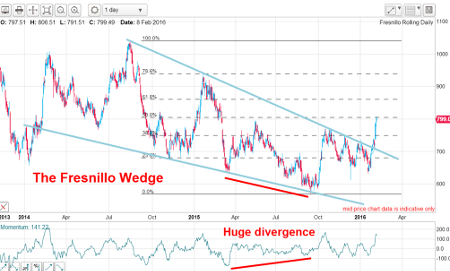
It has been forming for two years, and last week the market broke sharply above the upper wedge line in a show of force. That is about as bullish a signal as you will find.
The upper wedge line is as good as it gets, with multiple accurate touch points, making it a very reliable line of resistance. It has been transformed into a solid line of support with that break last week.
Not only that, but momentum diverged hugely at the recent sub-600p low. This suggests the rally should be considerable - and surpass last summer's high around 1,050p.
Outlook
The price has reached the Fibonacci 50% retrace of the decline off last summer's high. It could pause here, but should go on to test the 1,050p highs, with higher potential thereafter.
Update on Glencore
This share has been struggling to make upside progress and this is the wave count I have:
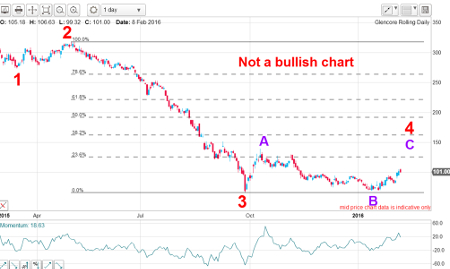
The market is in the process of making a complex wave four up, off the wave three low set last September. I have waves A and B of this wave four and currently we are making the final wave C of four.
I have been less than totally bullish on , and have suggested that very short-term trades could work out, but not so much longer-term positions. I suggest the company is scrambling to unload some assets (at the bottoms of the markets?) to reduce its mountain of debt. And, with corporate bond yields on the rise, that appears the most sensible course.
Outlook
Upside potential appears limited and I would not be surprised to see new lows below 67p in due course.
Update on Shell
A fortnight ago, I showed this chart on Shell:
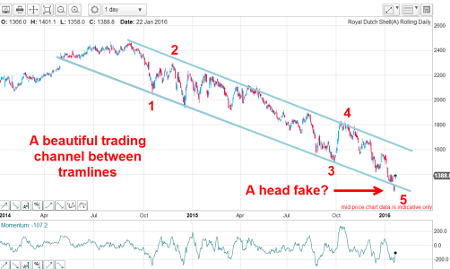
There is a lovely trading channel between my tramlines and I pointed out the "head fake" that heralded a rally phase. Also note the momentum divergence at this head fake, suggesting that the rally could have legs.
Indeed, the market has rallied and this is the current position this morning:
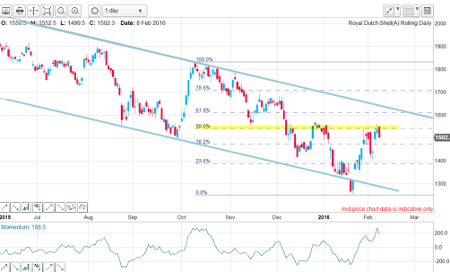
On Friday, Shell shares hit the Fibonacci 50% retrace of the decline off the October high - a natural point to at least pause. Now, with crude oil under some pressure, and looking to make new lows soon, this is a moment of truth for Shell.
Outlook
The shares may come back to test the lower tramline's support capability, but if they hold up well in the face of any weakness in crude, that will be a major bull signal. They will then go on to test my upper tramline.
Of course, trading below my head fake around the 1,300p level would cancel out this scenario and lead to further declines, which, I anticipate, would not be extensive.
And if crude oil reaches my target, which is much higher than the current $30, the oil majors will surely trade much, much higher.
This article is for information and discussion purposes only and does not form a recommendation to invest or otherwise. The value of an investment may fall. The investments referred to in this article may not be suitable for all investors, and if in doubt, an investor should seek advice from a qualified investment adviser.
These articles are provided for information purposes only. Occasionally, an opinion about whether to buy or sell a specific investment may be provided by third parties. The content is not intended to be a personal recommendation to buy or sell any financial instrument or product, or to adopt any investment strategy as it is not provided based on an assessment of your investing knowledge and experience, your financial situation or your investment objectives. The value of your investments, and the income derived from them, may go down as well as up. You may not get back all the money that you invest. The investments referred to in this article may not be suitable for all investors, and if in doubt, an investor should seek advice from a qualified investment adviser.
Full performance can be found on the company or index summary page on the interactive investor website. Simply click on the company's or index name highlighted in the article.
Disclosure
We use a combination of fundamental and technical analysis in forming our view as to the valuation and prospects of an investment. Where relevant we have set out those particular matters we think are important in the above article, but further detail can be found here.
Please note that our article on this investment should not be considered to be a regular publication.
Details of all recommendations issued by ii during the previous 12-month period can be found here.
ii adheres to a strict code of conduct. Contributors may hold shares or have other interests in companies included in these portfolios, which could create a conflict of interests. Contributors intending to write about any financial instruments in which they have an interest are required to disclose such interest to ii and in the article itself. ii will at all times consider whether such interest impairs the objectivity of the recommendation.
In addition, individuals involved in the production of investment articles are subject to a personal account dealing restriction, which prevents them from placing a transaction in the specified instrument(s) for a period before and for five working days after such publication. This is to avoid personal interests conflicting with the interests of the recipients of those investment articles.