Chart of the week: This bank share could double
29th February 2016 11:07
by John Burford from interactive investor
Share on
Today, I have two classic examples of the potential for big trading gains when you adopt a contrary stance once bearish sentiment has plumbed new depths.
First, I will cover shares, which have been hammered in recent months for the well-known litany of woes of falling commodity prices, an economic slowdown in Asia and an urgency to sell off unprofitable businesses. But it is the stand-out chart pattern I wish to draw your attention to.
Then, I will update my long-standing coverage of , which is following my roadmap nicely. Last month, that share was in a similar position to SC - declining sales and profits and a need to downsize - and is recovering.
Has Standard Chartered reached its low?
The bad news about Standard Chartered probably reached a climax on Friday when Standard & Poor's (S&P) placed the bank on negative watch. Previously, it was judged stable with a rating of A+. That means that the next time it is reviewed by S&P, if its rating is lowered, it would place terrific strain on its ability to raise funds as cheaply as its competitors.
But the really big hammer blow came last Tuesday when it reported a mammoth $1.5 billion (£1.1 billion) loss for the year compared with a $5.2 billion profit the previous year. That was some swing, and it hit the shares hard with a 10% decline that day.
Since then, the market has recovered, so my question is this: was that plunge last week the final selling exhaustion of stale longs who finally threw in the towel? Are there any more of these holders who are waiting in the wings to unload? Or are the new buyers very astute and see the shares recovering as costs are being pared while commodity prices appear to be rebounding?
As always, I look to the charts for answers. Here is the weekly chart showing the huge bear trend since 2013 from the 1,800p level down to last week's sub-400p low.
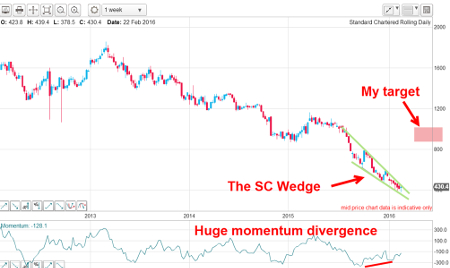
The two features that stand out for me are these: the lovely declining wedge going into the lows with the huge momentum divergence. Remember, a significant momentum divergence appearing after a lengthy trend (up or down) is a sign that the trend is very likely coming to an end.
That is potentially a very bullish setup.
Here is the latest action on the daily chart:
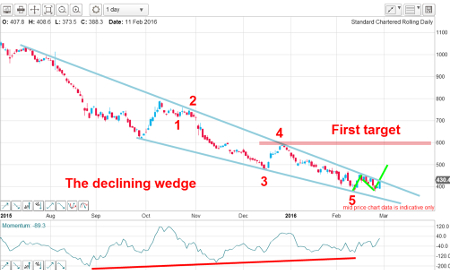
This chart shows up the classic declining wedge pattern that contains a complete five-wave sequence complete with its own large momentum divergence.
The market on Friday closed on the day's high touching the upper wedge line.
Outlook
If the market catches a bid and moves above the upper wedge line, that would help confirm the trend change to up. My first target becomes the 800p level, which is the wave four high (a common target). But, to activate that target, I need to see a rally above the 460p level.
If the market fails to move higher and instead moves down towards the lower wedge line, odds are high that the support at that line would be sufficient to stop the rot and put in a floor.
Update on Pearson
I last covered this share on 25 January and commented on the very bullish chart set-up. But, just before that date, the company announced major job cuts as well as yet one more profit warning that continued a string of poor results.
But in a classic case of "sell the rumour, buy the news" strategy, the share price started to recover from the dreadful collapse that took place during most of last year.
And on Friday, preliminary results were released showing sales down 2%, as was operating profit. Operating cash flow was down a whopping one-third from the previous year.
But markets do not move news, no matter how bearish! And in an absolute textbook example of a market turning when bullish sentiment is on the floor, the shares have moved up from the 750p area on 25 January to Friday's 838p close - a gain of 12% in about a month.
This is the updated daily chart:
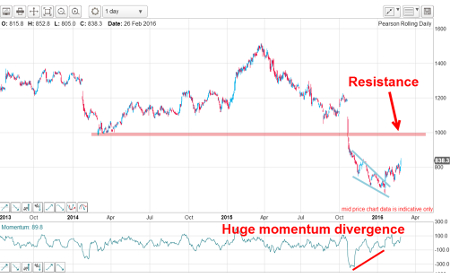
I pointed out the huge momentum divergence going into the January low which would likely herald a sharp rally phase. And that is what we are seeing.
There is stiff chart resistance at the 1,000p area, but the yawning October gap is a magnet for the rally. That area is also a Fibonacci 50% retrace of the entire wave down off the 2015 high. And the 50% level is one of the most common retracements found with counter-trend rallies.
Of course, a move to new lows would negate this bullish picture - an event I cannot rule out. But short-term traders have been offered a nice quick gain.
This could get interesting.
This article is for information and discussion purposes only and does not form a recommendation to invest or otherwise. The value of an investment may fall. The investments referred to in this article may not be suitable for all investors, and if in doubt, an investor should seek advice from a qualified investment adviser.
These articles are provided for information purposes only. Occasionally, an opinion about whether to buy or sell a specific investment may be provided by third parties. The content is not intended to be a personal recommendation to buy or sell any financial instrument or product, or to adopt any investment strategy as it is not provided based on an assessment of your investing knowledge and experience, your financial situation or your investment objectives. The value of your investments, and the income derived from them, may go down as well as up. You may not get back all the money that you invest. The investments referred to in this article may not be suitable for all investors, and if in doubt, an investor should seek advice from a qualified investment adviser.
Full performance can be found on the company or index summary page on the interactive investor website. Simply click on the company's or index name highlighted in the article.
Disclosure
We use a combination of fundamental and technical analysis in forming our view as to the valuation and prospects of an investment. Where relevant we have set out those particular matters we think are important in the above article, but further detail can be found here.
Please note that our article on this investment should not be considered to be a regular publication.
Details of all recommendations issued by ii during the previous 12-month period can be found here.
ii adheres to a strict code of conduct. Contributors may hold shares or have other interests in companies included in these portfolios, which could create a conflict of interests. Contributors intending to write about any financial instruments in which they have an interest are required to disclose such interest to ii and in the article itself. ii will at all times consider whether such interest impairs the objectivity of the recommendation.
In addition, individuals involved in the production of investment articles are subject to a personal account dealing restriction, which prevents them from placing a transaction in the specified instrument(s) for a period before and for five working days after such publication. This is to avoid personal interests conflicting with the interests of the recipients of those investment articles.