Chart of the week: Wedge breakout approaching
21st March 2016 11:14
by John Burford from interactive investor
Share on
Is Sage still a wise investment?
Whenever I see the company featured in print, I am always reminded of that well-known maxim, popular when I was young: "When ignorance is bliss, it is folly to be wise". I have always equated sagacity with wisdom ever since.
While there is a lot of truth in that one, Sage has done well for investors in recent years, with a new share price high registered recently. It remains the UK's leader in accounting and payroll software, especially for small businesses, and appears set to remain that way for some time.
Its steady, if unspectacular, progress has made it the classic "widows and orphans" holding.
With the huge increase in the self-employed ranks since the 2007-2009 credit crunch, demand for its products has been buoyant.
Today, I will analyse the price chart to assess the potential for further gains.
This is the daily chart showing the bull run:
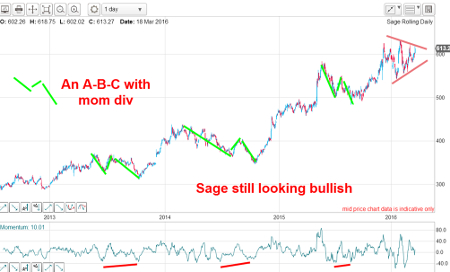
The uptrend has been normal with gains followed by consolidation periods where these have been in the typical three-wave A-B-C form, with small momentum divergences (mom div). This is a sign of a healthy bull market. The A-B-C form is almost always counter-trend and, in this case, the trend is up.
Outlook
In recent months, the chart has been forming a typical wedge. So long as the lower wedge line holds, I expect a thrust upwards out of the wedge in due course.
Naturally, if the market breaks below the 550p level, the bull trend will be in severe jeopardy.
Update on Fresnillo
I have been bullish on this share for some time. In my updates of 8 Februrary and 22 February, I explained how the wedge was pointing to much higher levels.
This was the chart on 8 February:
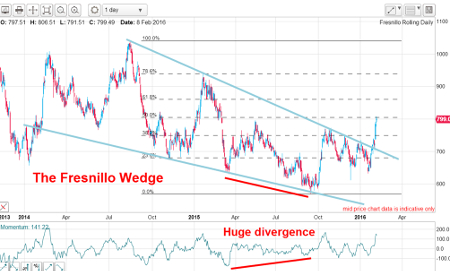
Not only do both blue wedge lines contain multiple, highly accurate touch points, making them highly reliable as lines of support (lower) and resistance (upper), but the huge momentum divergence at the sub-600p low pointed to a sharp rally phase just ahead, which was confirmed by the upper wedge line break at the 700p level.
And this is the updated chart:
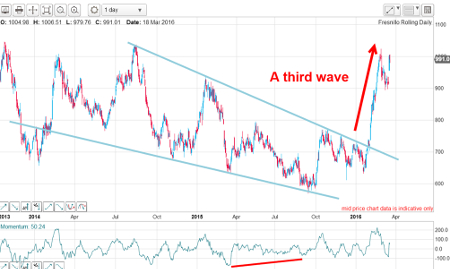
Right on cue, the sharp rally materialised, with the market hitting 1,000p last week - a jump of 40% from the wedge line break, which was my major 'buy' signal.
One very encouraging development recently was the downgrade to 'sell' from Deutsche Bank. Their reason? It has gone up "too far, too fast". In my book, that is like a red rag to a bull (literally). How many traders have been caught out by selling too soon and missing a major part of the rally?
I note that other "analysts" - and I use the term loosely - have just raised their target price from 560p to 750p in recent days. I don't know which hayrick they are sleeping on, but I have news for them - the share price is already way above their target.
Perhaps they expect the shares to decline to 750p at some point in the future. That would be a pretty good bet, so long as you gave it as long as it took. I find such claptrap entirely useless, except for giving me a valuable steer on market sentiment, of course.
Outlook
The rally has all the feeling of a third wave, which should be followed by a fifth up. When complete, a retracement down should ensue. Some profit-taking by short-term traders would be entirely justified here, but the medium- and long-term outlook remains bullish, with my medium term target around 1,300p.
Update on Shell
I last updated on 8 February. Recall, I have been bullish for a substantial rally phase following the "head fake" lows of late January, when the shares plunged to the 1,250p level.
This was the chart then:
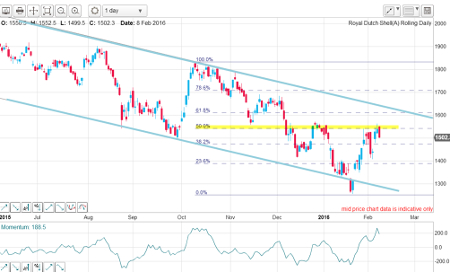
The rally had paused at the Fibonacci 50% level on a high momentum reading. That suggested that a small correction was likely. But my target remained my upper tramline in the 1,800p area (or slightly below because the upper tramline was trending downwards).
This is what I wrote on 25 January: "The path of least resistance appears to be up towards my upper tramline. A break above that will send the shares towards my first target in the 1800 area. "
This is the updated chart:
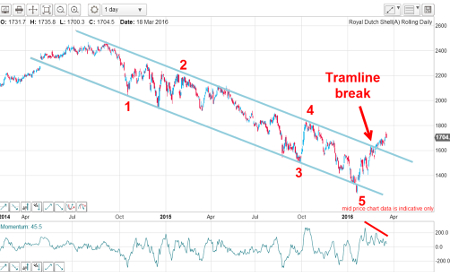
And, on cue, the market broke above my upper tramline late last month and made a high at the 1,750p level on Thursday.
Outlook
The rally to 1,750p has hit the Fibonacci 38% resistance level on a momentum divergence and that is inside the original 1,800p target zone. Taking some profits off the table appears prudent. Crude oil futures have also made an important Fibonacci target and appear ready for some consolidation.
This article is for information and discussion purposes only and does not form a recommendation to invest or otherwise. The value of an investment may fall. The investments referred to in this article may not be suitable for all investors, and if in doubt, an investor should seek advice from a qualified investment adviser.
These articles are provided for information purposes only. Occasionally, an opinion about whether to buy or sell a specific investment may be provided by third parties. The content is not intended to be a personal recommendation to buy or sell any financial instrument or product, or to adopt any investment strategy as it is not provided based on an assessment of your investing knowledge and experience, your financial situation or your investment objectives. The value of your investments, and the income derived from them, may go down as well as up. You may not get back all the money that you invest. The investments referred to in this article may not be suitable for all investors, and if in doubt, an investor should seek advice from a qualified investment adviser.
Full performance can be found on the company or index summary page on the interactive investor website. Simply click on the company's or index name highlighted in the article.
Disclosure
We use a combination of fundamental and technical analysis in forming our view as to the valuation and prospects of an investment. Where relevant we have set out those particular matters we think are important in the above article, but further detail can be found here.
Please note that our article on this investment should not be considered to be a regular publication.
Details of all recommendations issued by ii during the previous 12-month period can be found here.
ii adheres to a strict code of conduct. Contributors may hold shares or have other interests in companies included in these portfolios, which could create a conflict of interests. Contributors intending to write about any financial instruments in which they have an interest are required to disclose such interest to ii and in the article itself. ii will at all times consider whether such interest impairs the objectivity of the recommendation.
In addition, individuals involved in the production of investment articles are subject to a personal account dealing restriction, which prevents them from placing a transaction in the specified instrument(s) for a period before and for five working days after such publication. This is to avoid personal interests conflicting with the interests of the recipients of those investment articles.