Chart of the week: Why Next relief rally could start soon
4th April 2016 12:33
by John Burford from interactive investor
Share on
What is next for NEXT?
Shares in are falling out of bed. For years, they have been the darling of the British high street - but no more. They were even crushing rivals in women's fashions, I recall. But a series of sales disappointments starting around Christmas have dampened investor enthusiasm for the high-flying shares, which are now coming down to earth.
In previous times, sales growth was spectacular, but the outlook is for much lower growth this year.
Here is the weekly chart, showing the rapid rise off the 2009 lows:
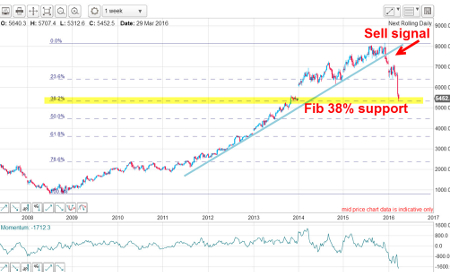
The rally from the 2,000p area in 2011 has followed along the blue uptrend line in textbook fashion. But since the strong gap opening in 2014, momentum has been tailing off, which gave a warning that the rally would probably terminate if the market could break below the multi-year trendline.
A break of a long-standing tramline is a trade signal under my tramline methods.
Alert traders and investors were advised to place a protect-profit stop to sell on such a break. That break arrived in December at the 7,500p area, also a short selling signal to reverse positons.
With the shares down to 5,500p on Friday, that was a superb trade in a little over three months - that move of 26% was surely worth going for.
And, on Friday, the market plunged right to the precise Fibonacci 38% retrace of the entire bull run off the 2009 lows. That is very pretty.
Here is a close-up on the daily:
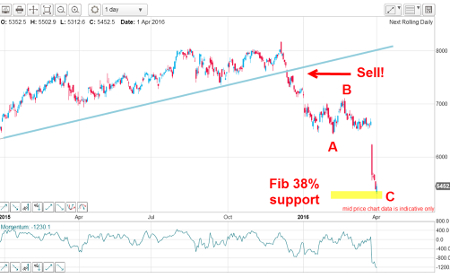
Following the December break on a down gap (a very bearish sign), the market plunged to the 6,500p area and tried to stabilise.
That was when many investors were buying on the theory that the shares were a bargain. They believed that the little dip in sales growth was just a blip and the good times would resume and the market would recover. But I am afraid they were catching a falling knife - the other shoe dropped when the plunge resumed on 24 March with a stupendous collapse of 700p in one day and settled lower on Friday at the 5,500p level.
I have placed A-B-C wave labels on the decline because, to my eye, that is what the form of the decline appears to be. The very interesting feature is that at Friday's low, wave A equals wave C in height - a common relationship. That places Friday's low as the likely full extent of the C wave and a potential major low that could lead to a major advance.
Not only that, but the huge gap in January 2014 has just been filled (see top chart). Market gaps are often closed, even if it takes many months to do it. That closure suggests a relief rally could start fairly soon.
The third clue is that the market has hit the Fibonacci 38% support level.
Outlook
Odds are good that the decline will stall around here and a relief rally of some proportion can get started from around current levels. But the market remains very nervous and just jumping in is a potentially very risky strategy. I would prefer to see more signs of basing action.
But so long as the 5,500p-ish level holds, a rally to the 6,500p area to close the gap would be normal, with possibly higher potential thereafter.
My longer-term outlook for retail shares in general is for turbulent times ahead. I would not hang around too long if targets have been hit. I do not believe Next is a long-term hold.
Update on Glencore
With mining shares now hot in the media, I thought I would update , which fell a very long way from grace last year. And the recovery has been stunning, with a gain of 160% off the 66p low made last September (with the interim low of 69p made mid-January).
When I last updated the shares, I believed the rally would carry to at least the Fibonacci 23% retrace off the 380p top made in 2014. It has certainly done that, but is currently short of the next Fibonacci level at 38%:
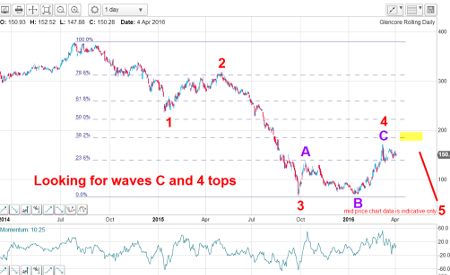
The rally is a C wave within a red wave four and, when it terminates, we should see a resumption of the downtrend. But will the market extend its rally to the yellow zone at the Fibonacci 38% level, around the 185p region?
Let's zoom in a little:
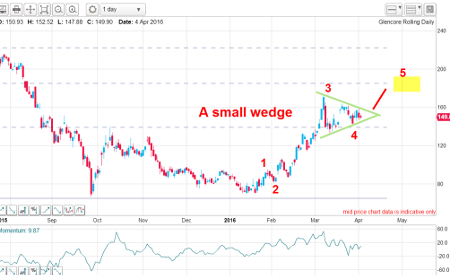
The C wave contains a long and strong wave three - following waves one and two - and is currently forming a triangle, or wedge - and that is a clue that the move out of it will be up. That is based on the observation that a true wedge in the fourth wave position usually precedes the final fifth wave thrust before reversing.
Outlook
Odds favour my target around the 185p area should be met, but the decline off it should be strong. Taking profits around that level appears very prudent.
This article is for information and discussion purposes only and does not form a recommendation to invest or otherwise. The value of an investment may fall. The investments referred to in this article may not be suitable for all investors, and if in doubt, an investor should seek advice from a qualified investment adviser.
These articles are provided for information purposes only. Occasionally, an opinion about whether to buy or sell a specific investment may be provided by third parties. The content is not intended to be a personal recommendation to buy or sell any financial instrument or product, or to adopt any investment strategy as it is not provided based on an assessment of your investing knowledge and experience, your financial situation or your investment objectives. The value of your investments, and the income derived from them, may go down as well as up. You may not get back all the money that you invest. The investments referred to in this article may not be suitable for all investors, and if in doubt, an investor should seek advice from a qualified investment adviser.
Full performance can be found on the company or index summary page on the interactive investor website. Simply click on the company's or index name highlighted in the article.
Disclosure
We use a combination of fundamental and technical analysis in forming our view as to the valuation and prospects of an investment. Where relevant we have set out those particular matters we think are important in the above article, but further detail can be found here.
Please note that our article on this investment should not be considered to be a regular publication.
Details of all recommendations issued by ii during the previous 12-month period can be found here.
ii adheres to a strict code of conduct. Contributors may hold shares or have other interests in companies included in these portfolios, which could create a conflict of interests. Contributors intending to write about any financial instruments in which they have an interest are required to disclose such interest to ii and in the article itself. ii will at all times consider whether such interest impairs the objectivity of the recommendation.
In addition, individuals involved in the production of investment articles are subject to a personal account dealing restriction, which prevents them from placing a transaction in the specified instrument(s) for a period before and for five working days after such publication. This is to avoid personal interests conflicting with the interests of the recipients of those investment articles.