Chart of the week: Upside potential of 50%
3rd May 2016 12:28
by John Burford from interactive investor
Share on
%20v2.png)
Following a string of highly profitable trading calls, technical analyst John Burford is offering ii readers a FREE TRIAL of his new Trade Alert email. Click here to find out how.
Weir Group rallies - but is there more?
, a major oil and gas services company, has been right in the firing line of the slowdown in US shale development in recent months as crude oil has weakened. It is also in the firing line of a taxpayer revolt over executive pay - a growing trend with FTSE 100 companies.
As I have been forecasting in these pages, the crude market has been in a sharp relief rally since January, and Weir has followed suit by bouncing off the depressed levels at around 800p.
But the chart is compelling, showing a textbook example of a long-term five up/three down - and here it is:
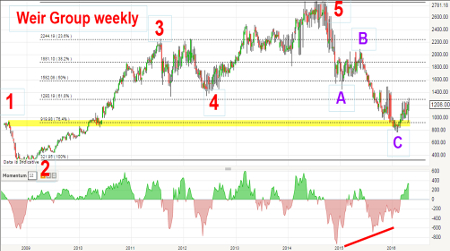
Wave one rises off the 2002 lows (not shown) and wave three is a typically long and strong impulsive wave that consists of its own internal five-up. Wave four is a typical A-B-C three-down and the final fifth wave is also a complex wave that has its own five-up.
The final wave-five high was put in at the £28 level in mid-2014 - and was a terrific place to take profits (which was flagged by this basic wave analysis). Since then, the market has been in a one-way bear trend, with the latest low of £8 being made early this year for a thumping loss of 70% off the high.
For readers who trust in the lazy, buy-and-hold approach to investing, this has been a wakeup call - and surely serves as stimulus to try and master at least the basics of Elliott wave theory. It can save a whole lot of pain.
Leaving the party when in full swing is often the best profit-maximising approachFor most investors, exiting an investment after the share has given you superb gains is the hardest task to accomplish.
This is so, especially when everything looks set fair at the top, when brokers are issuing confident and very bullish forecasts.
But that is precisely the time when maximum gains can often be realised. Leaving the party when in full swing is often the best profit-maximising approach. But it must be done when technical signals line up. That is where extreme discipline is needed.
How much easier is it to bask in the comfort of your lovely profitable investment and rationalise any decline as "just a temporary dip"? At such times, you will have plenty of company. You shut your eyes and ears to the declining quotes, hoping it will recover.
Then, weeks later, you glance over at the quotes and see that it has crashed to £8. What a shock - and you finally decide to sell out to rescue at least some value. And that happens to be the low as it slid down the "slope of hope". And that is how bear markets work in a nutshell.
From that £28 top, the market has descended in three clear waves - and right to the Fibonacci 78% support level (yellow bar). I can therefore label the descent as an A-B-C, especially since there is a large momentum divergence between the A and C waves.
Remember, a significant momentum divergence in a three-down means selling pressure is drying up and, when a relief rally gets started, it is usually sharp - and can cover a lot of ground quickly.
Here is a close-up of recent action:
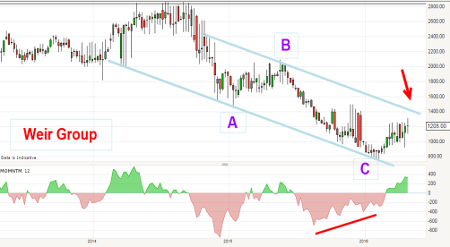
As of Friday, the market has rallied by 50% off January's lows and is heading for my upper blue tramline in the £13 area (currently £12.38).
With crude oil in a vigorous short squeeze rally, Weir should make it to my tramline, but then should encounter stiff resistance. That will be the critical test of the rally. If it can move above it with force, the £18 area becomes my immediate target.
But if it fails, a move back down to test the lows again appears likely.
Update on Fresnillo
My bullish forecast last year is working out well and I now have some clear Elliott waves on the rally off the winter lows between £6 and £7. The blue line is the upper edge of my wedge.
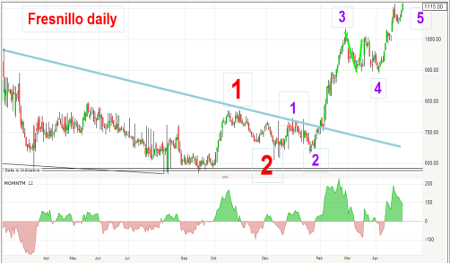
We are in the process of working a large degree third wave (red), but it is also near the end of the small degree purple wave five. This purple wave pattern appears textbook, with a long and strong third wave, a wave four in an A-B-C three-down, and a sharp thrust up in wave five which has not yet ended.
But, when wave five terminates, I expect a hefty decline - hopefully in a classic A-B-C. There is major resistance up ahead in the £12-£13 zone (currently £11.15), which would be a suitable area for the current rally to exhaust.
Here is the larger-scale chart:
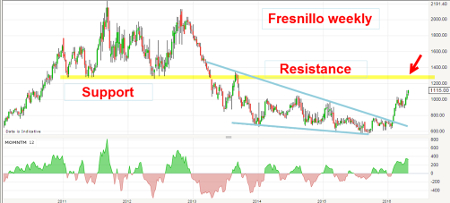
Note that the yellow resistance band was acting as major support prior to the break in 2013 and is now major resistance. Also, the £12-£13 area coincides with the start of my wedge - and this is often a major price target for recoveries.
Odds are high that upside progress is limited from here and the 'easy' money has been made.
This article is for information and discussion purposes only and does not form a recommendation to invest or otherwise. The value of an investment may fall. The investments referred to in this article may not be suitable for all investors, and if in doubt, an investor should seek advice from a qualified investment adviser.
These articles are provided for information purposes only. Occasionally, an opinion about whether to buy or sell a specific investment may be provided by third parties. The content is not intended to be a personal recommendation to buy or sell any financial instrument or product, or to adopt any investment strategy as it is not provided based on an assessment of your investing knowledge and experience, your financial situation or your investment objectives. The value of your investments, and the income derived from them, may go down as well as up. You may not get back all the money that you invest. The investments referred to in this article may not be suitable for all investors, and if in doubt, an investor should seek advice from a qualified investment adviser.
Full performance can be found on the company or index summary page on the interactive investor website. Simply click on the company's or index name highlighted in the article.
Disclosure
We use a combination of fundamental and technical analysis in forming our view as to the valuation and prospects of an investment. Where relevant we have set out those particular matters we think are important in the above article, but further detail can be found here.
Please note that our article on this investment should not be considered to be a regular publication.
Details of all recommendations issued by ii during the previous 12-month period can be found here.
ii adheres to a strict code of conduct. Contributors may hold shares or have other interests in companies included in these portfolios, which could create a conflict of interests. Contributors intending to write about any financial instruments in which they have an interest are required to disclose such interest to ii and in the article itself. ii will at all times consider whether such interest impairs the objectivity of the recommendation.
In addition, individuals involved in the production of investment articles are subject to a personal account dealing restriction, which prevents them from placing a transaction in the specified instrument(s) for a period before and for five working days after such publication. This is to avoid personal interests conflicting with the interests of the recipients of those investment articles.