Chart of the week: Bagging a 30% profit
9th May 2016 11:38
by John Burford from interactive investor
Share on
BHP Billiton hits my £10 target
I have been covering since January when it was in a severe bear trend that accompanied the plunge in commodity prices. Sentiment was off-the-scale gloomy and, as I wrote then, there were plenty of "obvious" reasons to expect a continuation of the lower trend.
But I also noted that this was a perfect setup that could provide the springboard for a "surprise" rally phase which would confound the majority of pundits - who follow the bogus theory that it is the data and news that make the markets.
I maintain they have the cart before the horse and, in reality, it is the markets that make the data and the news. Sounds counter-intuitive, doesn't it? But, once you put the horse before the cart, many market moves that were puzzling before suddenly become understandable.
On 14 March, I updated this share and noted that, in January, I had forecast a major low would very likely be made around that time. This is what I wrote in March:
Back in January, iron ore prices were on the floor trading under $40 a ton and this is what I wrote: "Of course, there is no shortage of 'reasons to short' BHP if you still erroneously believe that it is the fundamentals that drive markets. There is the on-going slowdown in China that will 'obviously' keep the lid on iron ore prices.
So did the obvious happen? Hardly. A few days ago, iron ore prices jumped 20% in one day and now trade around the $60 level - a full 50% above the January lows.
And in recent days, iron ore prices have moved even higher - much to the disbelief of most pundits. This is the chart for BHP that I showed in March:
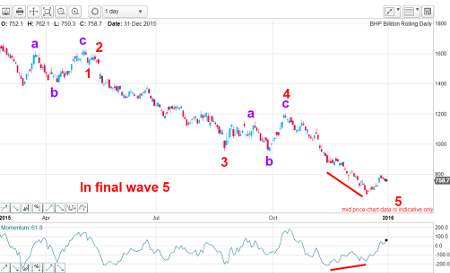
It's a beautiful demonstration of the power of analysing the wave structure rather than fundamental analysis. I made the bold prediction that the market was in the throes of the final fifth wave down and poised for a snap-back rally of some size. My view was reinforced by the large momentum divergence at the December low around the £7 level.
This was the other chart I featured in March that showed my lovely tramlines:
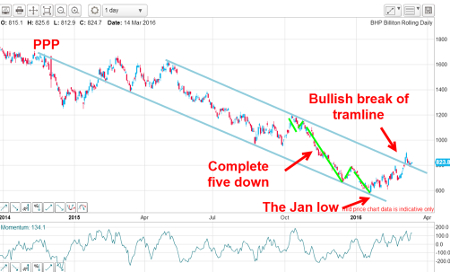
The wave patterns told me that a major low was indeed at hand and with the break of the upper tramline (a bull signal), I was able to confidently forecast a resumption of the rally with this forecast in March: "The recovery remains on track and my next target is the 1,000p area."
This is the chart updated to today:
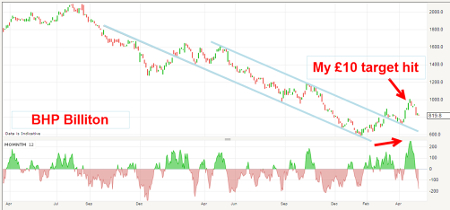
Bingo! My forecasted rally continued right up to the £10 level which was hit a few days ago. And, after hitting it, the market has backed off to the £8 area. The momentum chart at the bottom showed a very over-bought market near-term, and justified taking at least some profits off the table at £10.
So, if the share was bought a few months ago at around the £6-8 area when I first flagged it, and then taken profits at £10, the gain was excellent at over 30% in 2-3 months.
Timing is key
I am illustrating this because it is a perfect example of how I work my swing trades. As I have emphasised all along, I do not believe mining shares are long-term investments - they are ideal swing trading vehicles where anywhere from 20% to 80% gains are achievable within a few months - provided your timing is good. That is the key. And that is what my tramline methods can offer.
This applies in spades when trading the long side. That is so because the main trends are down in commodities and commodity shares. This reflects the overall deflationary macro environment we are in. The price highs of almost every major commodity were put in long ago. For instance, iron ore was trading over $140 three years ago (currently $60-plus having reached $40 recently).
To be a successful swing trader, you must be prepared to go against the consensus and trade against the main trend - and this is difficult for some. But, as the late great trader Joe Granville once said: "When everybody believes something is obvious, it is obviously wrong".
This article is for information and discussion purposes only and does not form a recommendation to invest or otherwise. The value of an investment may fall. The investments referred to in this article may not be suitable for all investors, and if in doubt, an investor should seek advice from a qualified investment adviser.
These articles are provided for information purposes only. Occasionally, an opinion about whether to buy or sell a specific investment may be provided by third parties. The content is not intended to be a personal recommendation to buy or sell any financial instrument or product, or to adopt any investment strategy as it is not provided based on an assessment of your investing knowledge and experience, your financial situation or your investment objectives. The value of your investments, and the income derived from them, may go down as well as up. You may not get back all the money that you invest. The investments referred to in this article may not be suitable for all investors, and if in doubt, an investor should seek advice from a qualified investment adviser.
Full performance can be found on the company or index summary page on the interactive investor website. Simply click on the company's or index name highlighted in the article.
Disclosure
We use a combination of fundamental and technical analysis in forming our view as to the valuation and prospects of an investment. Where relevant we have set out those particular matters we think are important in the above article, but further detail can be found here.
Please note that our article on this investment should not be considered to be a regular publication.
Details of all recommendations issued by ii during the previous 12-month period can be found here.
ii adheres to a strict code of conduct. Contributors may hold shares or have other interests in companies included in these portfolios, which could create a conflict of interests. Contributors intending to write about any financial instruments in which they have an interest are required to disclose such interest to ii and in the article itself. ii will at all times consider whether such interest impairs the objectivity of the recommendation.
In addition, individuals involved in the production of investment articles are subject to a personal account dealing restriction, which prevents them from placing a transaction in the specified instrument(s) for a period before and for five working days after such publication. This is to avoid personal interests conflicting with the interests of the recipients of those investment articles.