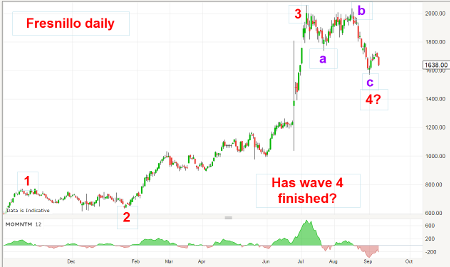
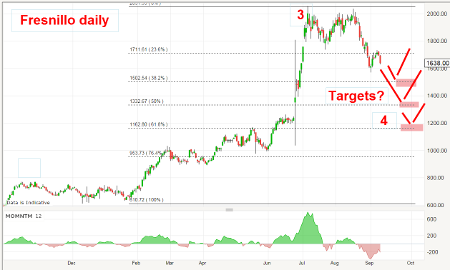
Chart of the week: A textbook trade
6th June 2016 14:47
by John Burford from interactive investor
Share on
3i is back on top
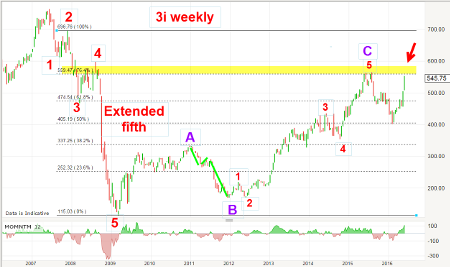
Private equity company is back in favour after a big slide from the June 2015 high to the February low - a decline of around 30%. But since then as the company has reduced its debt pile and sentiment towards tech has again reached for the stars, the market is back to last year's 560p high.
But the whole chart from the 2007 top is a textbook example of how to analyse charts using basic Elliott wave principles and Fibonacci ideas.

The big slide in 2007-2009 is a clear five-down with an extended fifth wave. Although these are not as common in share charts as in commodities, they do appear - and this one is textbook.
With the plunge lower in March 2009, the market has staged a leisurely recovery in three major waves in an A-B-C. The C wave sports a lovely five-up and ends right at the Fibonacci 78% resistance level. You will note that I chose the upper pivot point not on the absolute top, but on the wave 2 high. I have found that these wave 2 extremes can give a better fit to the highs and lows that come after. The wave A top now lies bang on the Fibonacci 38% level - and justifies my choice.
The market then reacted down with force off the wave C high at 550p, but is now in sharp recovery mode. If the market can power through this level, then an assault on the 750p high appears on the cards.
Update on Schroders
On 16 May, I covered this share as it has formed a beautiful tramline pair on the recent decline and at the recent 2,400p print, was bouncing off the crossing of the lower tramline with the Fibonacci 78% support level. This was the daily chart I showed:

Reverting back to the February period, I noted that the thrust down to the 2,300p level took place on a massive positive momentum divergence where the entire decline off the 2,600p level appeared to be a large counter-trend A-B-C pattern. That indicated to me that after the inevitable rally and then the corrective phase to the 2,400p May low, the odds favoured a resumption of the rally.
This is what I wrote: "The key level on the downside is the recent low at 2400. This low lies at the Fibonacci 78% support zone which is my last line of support. If that level gives way, odds are good that the market will move lower into new lows.
"The key level on the upside is the upper tramline in the 2550 area. Breaking above that level with power would confirm the turn and indicate a likely challenge to the £28 high back in March."
Let's fast-forward to today. Here is the recent action:

My critical 2,550p level was in fact decisively breached on the upper tramline break, and it was all systems go. The break of the tramline was a tradable event because according to my tramline trading rules, what was a line of resistance becomes a line of support on a break.
That little rally produced a 15% gain in three weeks. And my initial target at the 2,800p area was hit (a little leeway must be allowed when setting targets).
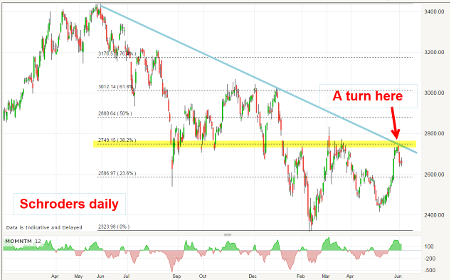
But now, how does the bigger picture look? Here is the daily chart going back a little further in time:

If I draw a line from the June 2015 top through the December high, it passes neatly through last week's top at 2,750p. That makes the trendline a very reliable line of resistance. But that's not all - the 2,750p print is at a precise Fibonacci 38% retrace of the entire decline off last year's high (yellow band). That makes the 2,750p point a formidable line of resistance - and was known well before the market had reached it!
For nimble traders, that was a precise target for taking a rapid profit, if desired. So for those traders entering the trade at 2,550p and exiting at 2,750p, a decent gain of 8% was achieved in three weeks with no risk to the trade! At no time did the market trade under the entry. I like those kind of trades.
This article is for information and discussion purposes only and does not form a recommendation to invest or otherwise. The value of an investment may fall. The investments referred to in this article may not be suitable for all investors, and if in doubt, an investor should seek advice from a qualified investment adviser.
These articles are provided for information purposes only. Occasionally, an opinion about whether to buy or sell a specific investment may be provided by third parties. The content is not intended to be a personal recommendation to buy or sell any financial instrument or product, or to adopt any investment strategy as it is not provided based on an assessment of your investing knowledge and experience, your financial situation or your investment objectives. The value of your investments, and the income derived from them, may go down as well as up. You may not get back all the money that you invest. The investments referred to in this article may not be suitable for all investors, and if in doubt, an investor should seek advice from a qualified investment adviser.
Full performance can be found on the company or index summary page on the interactive investor website. Simply click on the company's or index name highlighted in the article.
Disclosure
We use a combination of fundamental and technical analysis in forming our view as to the valuation and prospects of an investment. Where relevant we have set out those particular matters we think are important in the above article, but further detail can be found here.
Please note that our article on this investment should not be considered to be a regular publication.
Details of all recommendations issued by ii during the previous 12-month period can be found here.
ii adheres to a strict code of conduct. Contributors may hold shares or have other interests in companies included in these portfolios, which could create a conflict of interests. Contributors intending to write about any financial instruments in which they have an interest are required to disclose such interest to ii and in the article itself. ii will at all times consider whether such interest impairs the objectivity of the recommendation.
In addition, individuals involved in the production of investment articles are subject to a personal account dealing restriction, which prevents them from placing a transaction in the specified instrument(s) for a period before and for five working days after such publication. This is to avoid personal interests conflicting with the interests of the recipients of those investment articles.