Chart of the week: FTSE 100 and financials
20th June 2016 14:45
by John Burford from interactive investor
Share on
The extreme volatility in share prices surrounding the Brexit referendum vote this week is playing havoc with chart patterns, as markets swing wildly in time, with polls zig-zagging between 'in' and 'out'. This action has validated my own trading stance, which was to avoid taking large new positions going into 23/24 June.
For instance, this month alone the FTSE index has swung from a high of 6,323 on 7 June to a low of 5,890 last Thursday (a decline of 433 points, or 7%). And as I write this morning, the index is trading at 6,220 - a recovery of 330 points in just two days! That's what I call volatility.
And what started out as a clear breach of support at the 6,050 level (that suggested to me that a downtrend was in force) has morphed into a full-blown rally phase! Here is the updated FTSE daily chart:
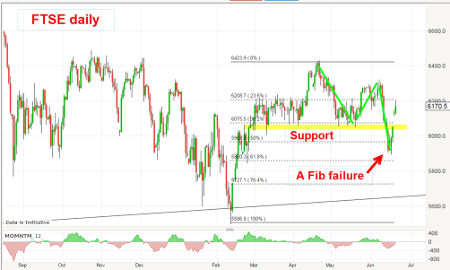
The shelf of support at 6,050 has been building for a few months and I judged that to be a reliable tell that, if that support could be broken, a decent downtrend would develop. But the market headed towards the usually-reliable Fibonacci 62% support level last week and, then, odds favoured a further decline to at least meet it.
However, sometimes great odds for a particular result do not play out in practice (which is why 100:1 horses can and do win races). And overnight, with a rapid switch to risk-on, global stockmarkets have surged to produce a "failed" Fibonacci target.
Today, I thought I would review charts of two shares I have been covering here.
Schroders
For an extreme example of volatility, here is , which I last updated on 6 June, when I noted that my upside target at 2,750p had just been hit and a downtrend was likely:
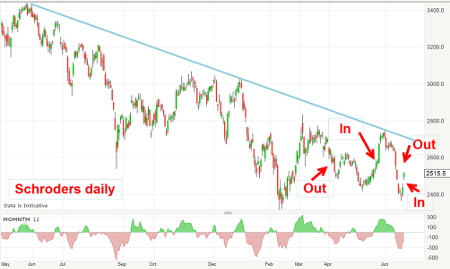
I note the zigs and zags that have been influenced by the to-and-fro of the Brexit polls. It is not my job (thank goodness) to judge the merits of staying in or leaving the European Union (EU). I have the far easier job of noting where other traders believe shares are heading and making price forecasts!
But the sharp decline last week almost into a new low below 2,400p was a sure sign of panic at work as the 'out' camp was in a clear lead.
Something strange happened on the way to Exit, though, and in a sudden switch in sentiment, shares are powering ahead today.
To me, this is a clear demonstration of a highly emotional market and, in such circumstances, usually-reliable chart patterns are often violated. And that is why I decided to reduce trading activity.
But the fog will probably clear after the referendum and, when it does, I am confident the chart patterns will be readable once more.
Standard Chartered
is a share I have been bullish on for some time. In fact, in my 29 February Chart of the Week, as the shares were making their lows around the 400 area, I pointed out the lovely five-down nature of the decline off the 1,150p high last year. This is my Elliott wave analysis:
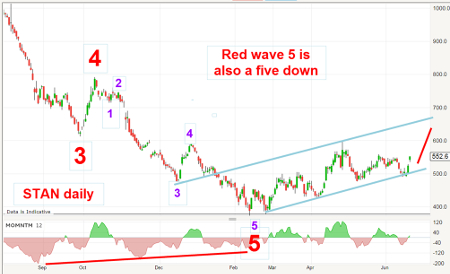
The red wave five contains a very clear five-down and, with the large momentum divergence, that was all I needed to confirm a reversal was due.
I also have a lovely blue tramline pair working where the market tested the lower tramline last week on exaggerated Brexit fears that made headlines as the FTSE lost umpteen billions in value.
Note that STAN greatly resisted this wobble - and is a clue that the rally now can have considerable legs.
Here is the expanded chart:
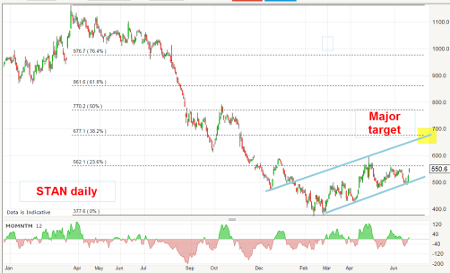
Major resistance lies in the 600p area, but I remain with my major target at the meeting of the Fibonacci 38% resistance level and my upper tramline.
A break of 600p with force would be very bullish.
This article is for information and discussion purposes only and does not form a recommendation to invest or otherwise. The value of an investment may fall. The investments referred to in this article may not be suitable for all investors, and if in doubt, an investor should seek advice from a qualified investment adviser
These articles are provided for information purposes only. Occasionally, an opinion about whether to buy or sell a specific investment may be provided by third parties. The content is not intended to be a personal recommendation to buy or sell any financial instrument or product, or to adopt any investment strategy as it is not provided based on an assessment of your investing knowledge and experience, your financial situation or your investment objectives. The value of your investments, and the income derived from them, may go down as well as up. You may not get back all the money that you invest. The investments referred to in this article may not be suitable for all investors, and if in doubt, an investor should seek advice from a qualified investment adviser.
Full performance can be found on the company or index summary page on the interactive investor website. Simply click on the company's or index name highlighted in the article.
Disclosure
We use a combination of fundamental and technical analysis in forming our view as to the valuation and prospects of an investment. Where relevant we have set out those particular matters we think are important in the above article, but further detail can be found here.
Please note that our article on this investment should not be considered to be a regular publication.
Details of all recommendations issued by ii during the previous 12-month period can be found here.
ii adheres to a strict code of conduct. Contributors may hold shares or have other interests in companies included in these portfolios, which could create a conflict of interests. Contributors intending to write about any financial instruments in which they have an interest are required to disclose such interest to ii and in the article itself. ii will at all times consider whether such interest impairs the objectivity of the recommendation.
In addition, individuals involved in the production of investment articles are subject to a personal account dealing restriction, which prevents them from placing a transaction in the specified instrument(s) for a period before and for five working days after such publication. This is to avoid personal interests conflicting with the interests of the recipients of those investment articles.