Chart of the week: Brexit blows charts wide open
27th June 2016 12:03
by John Burford from interactive investor
Share on
This is not usually a political piece, but I cannot ignore the Brexit result last week, which will continue to have massive repercussions in almost every market around the globe for some time to come. In the UK, there is so much turmoil in the political fallout that even the winning side factions are at war with each other!
Is it possible that the UK, which has for so long been held up as the poster-child of parliamentary democracy for the rest of the world, is approaching a state of anarchy? It doesn't seem so very preposterous now that the established two-party system is under the greatest threat it has ever faced. The Brexit result shows that the 99% have finally had their say - and the political classes are running scared.
Before, every time there has been a sell-off, the central banks have succeeded in convincing the market that they still had the power to prevent a melt-down. They did this by adding liquidity and lowering interest rates - sometimes to below zero in some Eurozone states.
There is now talk that we could see negative policy rates in the UK and re-introducing QE is likewise now in the frame. But would blowing up the Bank of England's balance sheet even more be seen by the market as an act of desperation - and a reason to sell? Or would it be seen as yet another in the long line of 'stimulus' measures that leads in a knee-jerk way to higher stock prices?
Of course, it comes down to the level of confidence in central banks' power over markets. A clue a change is in the air has been given by the Brexit result, where the social mood is clearly moving against confidence in the authorities. The public simply did not believe the "experts" and those in power. The mood is darkening.
Today, the UK finds itself in a state of near-anarchy with a lame duck Prime Minister (and Chancellor) and a disintegrating Labour party. These conditions are ripe for the formation of splinter parties - and continued polarisation of the populace. In these conditions, stockmarkets would find it difficult to gather the courage to mount significant rallies.
A polarised nation produces a polarised stockmarket, with bulls and bears slugging it out with fierce intensity. Huge swings up and down will become normal and trading will be much more hazardous.
Immense damage
So, I will cover a few shares that I have been following for "Chart of the week" that illustrate the immense damage that Brexit has done to some charts. In fact, the damage has been so great that my usual tramline method of analysis has become almost impossible to use - at least for now. But not for all!
Companies that have significant overseas earnings will see those earnings magnified by the effect of the cheaper sterling exchange rates. Even the battered euro gained by 5% or so on Friday, while the US dollar soared by more than 10% overnight.
First, the good news (for the bulls). Here is , which I last updated on 13 June. Pearson has significant overseas earnings - and this is how the market views the sudden jump in those margins:
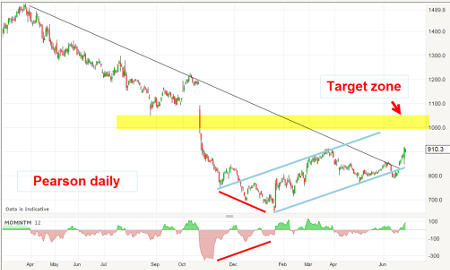
I have been bullish on this share for some time after noting the huge momentum divergence in February, which leads me to expect a run-up to my target zone in the 1,000p area at least.
And with the flight to precious metals, with silver gaining a massive $1 per ounce on Friday at one time, my favourite 2016 trade likewise made significant gains. But the thrust carried right up to my Fibonacci 62% target zone:
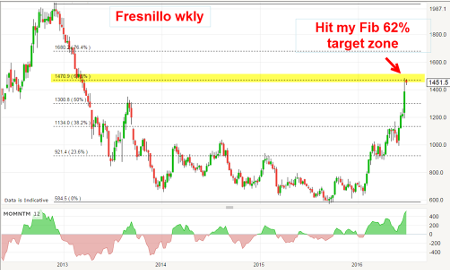
Investors have enthusiastically been piling into gold and silver, and with the bull camp full to overflowing compared with the bear camp, this would be a great opportunity for traders and investors alike to take at least some profits off the table.
Remember, I started getting interested in this share at the 600-700p area when it was deeply unloved. Now it is totally embraced in a love-fest as the massive herd has moved to the other side of the ledger.
My longer-term targets are for one final push, perhaps to the 2,000p area, but in the near-term, odds favour a decent pull-back.
Now for the not-so-good news (for the bulls, that is). Here is , a share I believed was in the process of basing around the 5,000p area following a massive decline off last year's 8,000p high:
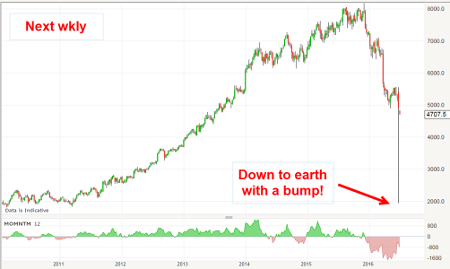
On Friday there were virtually no buyers down to the low at 2,000p, where it suddenly found them. The share then staged a massive recovery, but still ended below the 5,000p level.
This is a terrific example of a UK company that imports its products that are now that much dearer in sterling terms while conditions on the High Street are as competitive as ever. The squeeze on profit margins will be immense.
Finally, here is , which I have been negative on since last year:
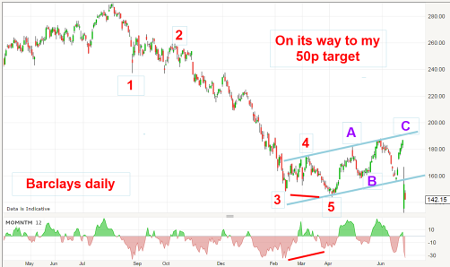
The rally last week was clearly a head-fake as the Remainers expected to win the referendum. But the Elliott waves are quite clear. The relief rally off the 5 April low is an A-B-C and now with new lows for the move at the 140p area, my sights are firmly set on my ultimate sub-50p target.
I see no reason to abandon shorts.
This article is for information and discussion purposes only and does not form a recommendation to invest or otherwise. The value of an investment may fall. The investments referred to in this article may not be suitable for all investors, and if in doubt, an investor should seek advice from a qualified investment adviser.
These articles are provided for information purposes only. Occasionally, an opinion about whether to buy or sell a specific investment may be provided by third parties. The content is not intended to be a personal recommendation to buy or sell any financial instrument or product, or to adopt any investment strategy as it is not provided based on an assessment of your investing knowledge and experience, your financial situation or your investment objectives. The value of your investments, and the income derived from them, may go down as well as up. You may not get back all the money that you invest. The investments referred to in this article may not be suitable for all investors, and if in doubt, an investor should seek advice from a qualified investment adviser.
Full performance can be found on the company or index summary page on the interactive investor website. Simply click on the company's or index name highlighted in the article.
Disclosure
We use a combination of fundamental and technical analysis in forming our view as to the valuation and prospects of an investment. Where relevant we have set out those particular matters we think are important in the above article, but further detail can be found here.
Please note that our article on this investment should not be considered to be a regular publication.
Details of all recommendations issued by ii during the previous 12-month period can be found here.
ii adheres to a strict code of conduct. Contributors may hold shares or have other interests in companies included in these portfolios, which could create a conflict of interests. Contributors intending to write about any financial instruments in which they have an interest are required to disclose such interest to ii and in the article itself. ii will at all times consider whether such interest impairs the objectivity of the recommendation.
In addition, individuals involved in the production of investment articles are subject to a personal account dealing restriction, which prevents them from placing a transaction in the specified instrument(s) for a period before and for five working days after such publication. This is to avoid personal interests conflicting with the interests of the recipients of those investment articles.