Chart of the week: Three for the bulls
4th July 2016 13:52
by John Burford from interactive investor
Share on
The Brexit affair is having a huge effect on many shares, but not on others. I showed a few last week. But one such share that was little moved is which I featured on 13 June.
I noted that sentiment towards the company was surely at rock-bottom with a string of corporate disasters hitting confidence. And that is usually a situation that stirs my contrarian juices! I happen to believe in the age-old maxim to "buy low, sell high" as a path to wealth. Many traders seem to believe the opposite.
I showed the incredible "Serco rollercoaster" chart where the share price has zoomed up to the 700p level, then crashed down to the 100p area. It then did what all rollercoasters do - zoom back up to the 700p level and then crashed back down again to the 100p area, where it has languished for some months as it was forming an ending wedge pattern.
This is what I wrote:
With this bullish setup, I expect a prompt test of the initial 220-240p target zone. But if the market immediately falls back below the 100p level (on Brexit worries?), that would probably indicate a test of the upper blue line at around the 90p area and should set up a kiss and scalded cat bounce.
In fact, the market did drop to the 95p level post-Brexit, but then staged a recovery and is trading around the 110p level this morning.
I believe this resilience in the face of massive initial Brexit selling is a clear demonstration that there is good underlying support at around current levels. Here is the updated daily chart:
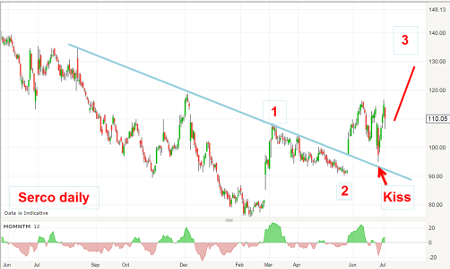
And what a cracker of a kiss! When my blue trendline was broken to the upside last month, with a large opening gap, it heralded a move up because my trendline was a line of resistance, which became a line of support with the break.
And when Brexit broke, that enabled the market to back down to plant a kiss on the line and then embark on a scalded cat bounce.
So now, the market appears poised to make further strides towards my main target in the 220-240p area.
Shire also in a kiss
I recently covered and became bullish on it - but Brexit hit it for six, with a sharp sell-off to a low in the 3,800p area. Unfortunately, that almost certainly took out a lot of stops. That is the price one pays for using protective stops.
The market has recovered since then and it's trading around the 4,700p level this morning.
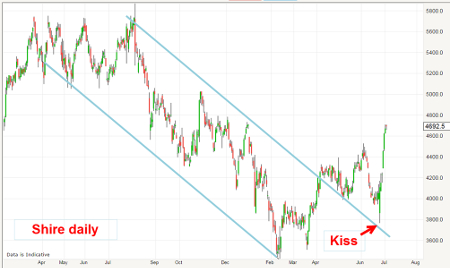
But what a great example of how to act professionally. Instead of licking your wounds and going into a shell, a careful reassessment of the situation would have probably encouraged you to re-enter the market - especially when you glanced at the near-kiss on the chart!
The market was in a support zone.
And here is another interesting chart in , which I covered recently as a great example of a share in a solid bull trend.
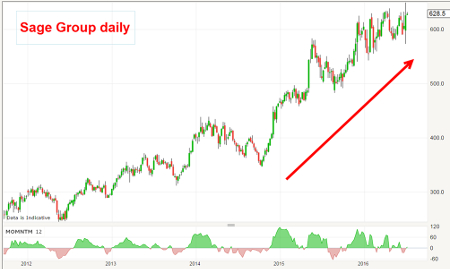
This is the daily chart and shows the Brexit fallout was minor - and the market quickly recovered. The market should continue in this vein unless the Brexit low of 570p is broken. Otherwise, I see no reason to change my bullish stance.
This article is for information and discussion purposes only and does not form a recommendation to invest or otherwise. The value of an investment may fall. The investments referred to in this article may not be suitable for all investors, and if in doubt, an investor should seek advice from a qualified investment adviser.
These articles are provided for information purposes only. Occasionally, an opinion about whether to buy or sell a specific investment may be provided by third parties. The content is not intended to be a personal recommendation to buy or sell any financial instrument or product, or to adopt any investment strategy as it is not provided based on an assessment of your investing knowledge and experience, your financial situation or your investment objectives. The value of your investments, and the income derived from them, may go down as well as up. You may not get back all the money that you invest. The investments referred to in this article may not be suitable for all investors, and if in doubt, an investor should seek advice from a qualified investment adviser.
Full performance can be found on the company or index summary page on the interactive investor website. Simply click on the company's or index name highlighted in the article.
Disclosure
We use a combination of fundamental and technical analysis in forming our view as to the valuation and prospects of an investment. Where relevant we have set out those particular matters we think are important in the above article, but further detail can be found here.
Please note that our article on this investment should not be considered to be a regular publication.
Details of all recommendations issued by ii during the previous 12-month period can be found here.
ii adheres to a strict code of conduct. Contributors may hold shares or have other interests in companies included in these portfolios, which could create a conflict of interests. Contributors intending to write about any financial instruments in which they have an interest are required to disclose such interest to ii and in the article itself. ii will at all times consider whether such interest impairs the objectivity of the recommendation.
In addition, individuals involved in the production of investment articles are subject to a personal account dealing restriction, which prevents them from placing a transaction in the specified instrument(s) for a period before and for five working days after such publication. This is to avoid personal interests conflicting with the interests of the recipients of those investment articles.