Chart of the week: A terrific opportunity
18th July 2016 12:10
Prudential - is it ready to rally?
is not nearly as sexy a share as a gold miner or a pharma of course, but as the classic 'widows and orphans' stock, I believe it offers a terrific opportunity. And that is because of the patterns I see in the price chart.
The share high of almost £18 was made last year, and since then it has suffered from a growing negative sentiment surrounding its emerging market business. When commodities were in a bear trend until earlier this year, the conventional wisdom was that emerging economies would suffer and Prudential's business model would be hit hard as layoffs in oil and mining proliferate.
Prudential's strategy is to offer financial services to the potentially growing market of under-provided middle-class group.
Of course, when any apocalyptic scenarios are painted, you can be sure that the bearish sentiment has been overdone. And that spells a possible buying opportunity.
Here is the long-range weekly chart back to the 2009 low.
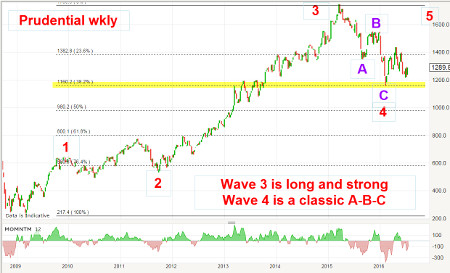
This is a textbook Elliott wave chart showing wave 2 as an A-B-C, a long and strong wave 3 to the 2015 high, and an A-B-C wave 4 down to an accurate hit-and-bounce on the Fibonacci 38% support level. So far, so textbook.
In fact, if you were paying attention earlier this year, you would have noted the wave 4 low at that Fibonacci level and likely concluded that at that £11 level, it represented a superb low-risk entry.
Since then, the market has rallied up to the £14 level and is in consolidation mode today.
Let's take a closer look on the daily chart
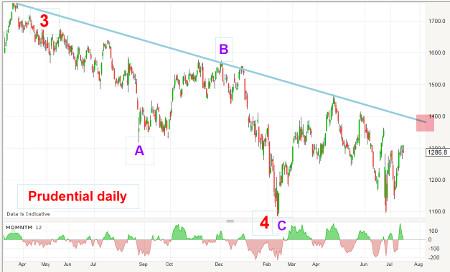
This is wave 4 in A-B-C form. Remember, three-wave patterns are always corrective to the main trend (up). I also have a good blue trendline which contains four accurate touch points. To be considered a reliable line of resistance (for a down-sloping trendline), I need to see at least three accurate touches - and this one qualifies.
So now, the market is edging up towards the trendline and will meet it at around the £14 level, and then on to new highs above £18.
But what could go wrong with this scenario?
For one thing, the rally off the 27 June low at £11 is an A-B-C so far and that means the market still has potential to reverse back down at any time.
And a break of that £11 low would put into great jeopardy the immediate bullish case.
The other point is that the market is eating into a lot of overhead resistance that could inhibit its progress.
The key level is the double bottom wave 4 low at the £11 level.
Outlook
So long as the £11 level holds, the trend is up and a test of the £14 level is likely. And if it can break above that level with force, odds become good for a test of the B wave high at around the £16 level.
Fresnillo reaches my long-term target
Back last year, silver miner was totally unloved. I would even guess that most investors had not even heard of the company! But as I pointed out at the time, this is precisely the time when canny investors should go off the beaten track and consider the profit potential when shares are easy to acquire from the beaten-down stale longs who are only too eager to sell to you.
But how times change! Now, the share is on nearly everyone's lips as it has risen exponentially along with silver's massive bull run.
I updated on May 31 when the shares had rallied to the £11 area and this is what I wrote then:
"But longer-term, the rally in silver (and gold) and the miners is not yet over. In the months to come, I expect new highs in silver above the recent $18 high - perhaps towards the $25 area and that will drag Fresnillo up well above the £12 high - perhaps close to the £20 region, which is the area of the major highs in 2011 and 2012."
So how has my forecast worked out? Here is the updated daily chart
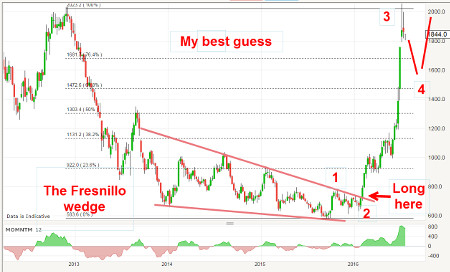
I would say - not bad. The market took off like a rocket in June and into July and last week the shares hit my £20 target in style.
And that should be wave 3 (long and strong) of what should be a five-up.
Remember, my forecast was partly based on the Fresnillo Wedge that I identified before it had even been completed last year. And what a wonderful forecasting tool is the wedge!
Outlook
I expect a decline in wave 4 (in a classic A-B-C?) and then a move to a new high in wave 5 above £20. The alternative is that the decline could be deeper since bullish sentiment is off the scale.
But that hit on my £20 target was an ideal time to take at least some profits off the table.
These articles are provided for information purposes only. Occasionally, an opinion about whether to buy or sell a specific investment may be provided by third parties. The content is not intended to be a personal recommendation to buy or sell any financial instrument or product, or to adopt any investment strategy as it is not provided based on an assessment of your investing knowledge and experience, your financial situation or your investment objectives. The value of your investments, and the income derived from them, may go down as well as up. You may not get back all the money that you invest. The investments referred to in this article may not be suitable for all investors, and if in doubt, an investor should seek advice from a qualified investment adviser.
Full performance can be found on the company or index summary page on the interactive investor website. Simply click on the company's or index name highlighted in the article.
Disclosure
We use a combination of fundamental and technical analysis in forming our view as to the valuation and prospects of an investment. Where relevant we have set out those particular matters we think are important in the above article, but further detail can be found here.
Please note that our article on this investment should not be considered to be a regular publication.
Details of all recommendations issued by ii during the previous 12-month period can be found here.
ii adheres to a strict code of conduct. Contributors may hold shares or have other interests in companies included in these portfolios, which could create a conflict of interests. Contributors intending to write about any financial instruments in which they have an interest are required to disclose such interest to ii and in the article itself. ii will at all times consider whether such interest impairs the objectivity of the recommendation.
In addition, individuals involved in the production of investment articles are subject to a personal account dealing restriction, which prevents them from placing a transaction in the specified instrument(s) for a period before and for five working days after such publication. This is to avoid personal interests conflicting with the interests of the recipients of those investment articles.
Editor's Picks