Chart of the week: Two biggies in trouble
25th July 2016 12:17
by John Burford from interactive investor
Share on
Rolls Royce loses £2 billion on sterling
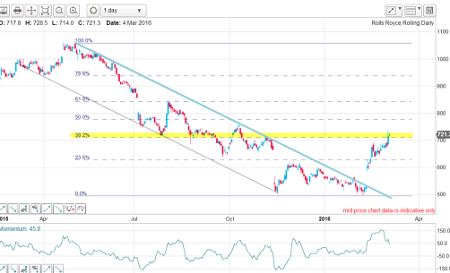
I last updated on 7 March, while the share was making a bullish breakout following a deep slide. On the daily chart, I had a lovely tramline pair working and, in February, the market gapped above the upper blue tramline (a bullish trading signal) and had hit the Fibonacci 38% resistance level at the 720p level in early March.
This is what I wrote:
"If the general market starts a decline near-term, it is not out of the question that the market may attempt to close the gap below 600p before looking to resume its advance. That is one serious option. The other is that the market may dip a little from here and continue on its way in what may turn out to be an A-B-C counter-trend rally."
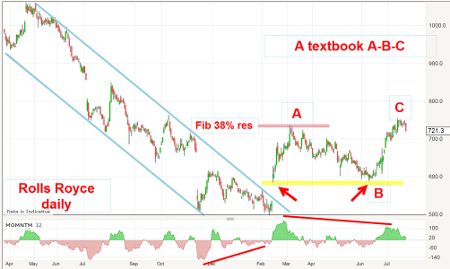
In fact, this roadmap I laid out in early March was followed in perfect fashion. Here is the daily chart updated:
But first note the large momentum divergence building at the February low - a clear sign the selling pressure was waning and to expect a rally phase.
Following the turn down off the Fibonacci 38% resistance in early March, the market declined but only back to the exact point of the high of the February gap - a typical turning point (yellow bar at the 590p level). That low - my wave B low - left the original gap unclosed, and this allowed the market to stage a strong recovery in wave C back to the Fibonacci 38% resistance zone where it lies currently.
A £2 billion hit sounds like real money to me, even to a FTSE 100 companySo now I have my A-B-C that I forecast back in March - and there were two very low-risk trade opportunities along the way - at the A wave high and at the B wave low. The question now is: is there another trade opportunity being presented and has the C wave high been made? If so, a resumption of the decline lies ahead.
Last week, it was revealed that Rolls had made a staggering loss of £2 billion on adverse currency moves. They had failed to hedge their currency exposure correctly. In typical BS-speak, the company called it an "accountancy adjustment", so of no real consequence in their eyes.
I must say that if I go to Europe this summer, my beers will cost me in sterling a very real accountancy adjustment of 20% greater than before Brexit. So in the real world outside of FTSE 100 boardrooms, I will have less spending power with the drop in sterling.
But a £2 billion hit sounds like real money to me, even to a FTSE 100 company - and the shares should be knocked down if only because their currency hedging strategist is clearly incompetent.
Incidentally, I was on the right side of the sterling devaluation over Brexit and have held short positions in GBP/USD for many months. I see no reason why my long-term forecast for at least 1.14 cannot be achieved.
Over the years, I have found that, in general, FTSE 100 companies have very ineffective currency hedging policies in place (except perhaps the oil majors) - which has remained a mystery to me as currency moves can impact the bottom line in a very big way (as with RR).
Outlook
The shares track the FTSE 100 index quite accurately and with that index at a major resistance level around 6,700, odds are good that any further advance in RR. will be hard-won. The odds are swinging towards a resumption of the decline.
Has Randgold made its high for 2016?
I began covering when it was totally unloved and neglected last December - and is a terrific example from the "buy low, sell high" school of making huge profits.
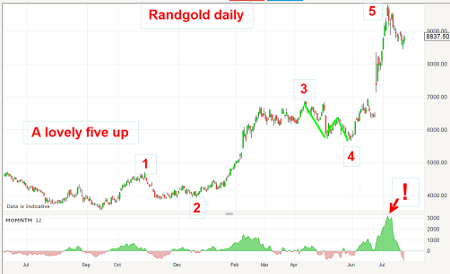
My first interest was sparked during wave two and, when the market moved into new highs above the wave one low, that was the signal the bull phase had started. Wave three to the £68 area is long and strong (a give-away that characterises a third wave). Wave four is a classic A-B-C correction and now wave five is a very extended upward thrust, which is typical of commodity-related markets.
That sharp move to the wave five high at £98 occurred as gold was also making its recent high at $1375 (currently trading at $1315) - and note the hugely overbought momentum reading at the high.
That fifth wave contains some very interesting features - here is the 4-hr chart of it:
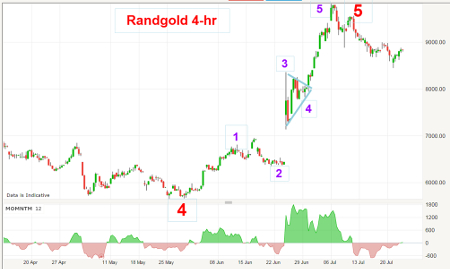
I have a five up within the fifth wave, with wave three containing the huge gap opening in June, a nice triangle in wave four and a final thrust in wave five. Also note the small momentum divergence between purple waves three and five.
Outlook
With a complete five-up on two degrees of scale, odds are good that a new downtrend has started. The first target is the purple wave four low at the £80 area.
And if the downtrend becomes established, that large gap at the £70 area looms as a target. Longer-term, I have a major support target at the £58 area.
This article is for information and discussion purposes only and does not form a recommendation to invest or otherwise. The value of an investment may fall. The investments referred to in this article may not be suitable for all investors, and if in doubt, an investor should seek advice from a qualified investment adviser.
These articles are provided for information purposes only. Occasionally, an opinion about whether to buy or sell a specific investment may be provided by third parties. The content is not intended to be a personal recommendation to buy or sell any financial instrument or product, or to adopt any investment strategy as it is not provided based on an assessment of your investing knowledge and experience, your financial situation or your investment objectives. The value of your investments, and the income derived from them, may go down as well as up. You may not get back all the money that you invest. The investments referred to in this article may not be suitable for all investors, and if in doubt, an investor should seek advice from a qualified investment adviser.
Full performance can be found on the company or index summary page on the interactive investor website. Simply click on the company's or index name highlighted in the article.
Disclosure
We use a combination of fundamental and technical analysis in forming our view as to the valuation and prospects of an investment. Where relevant we have set out those particular matters we think are important in the above article, but further detail can be found here.
Please note that our article on this investment should not be considered to be a regular publication.
Details of all recommendations issued by ii during the previous 12-month period can be found here.
ii adheres to a strict code of conduct. Contributors may hold shares or have other interests in companies included in these portfolios, which could create a conflict of interests. Contributors intending to write about any financial instruments in which they have an interest are required to disclose such interest to ii and in the article itself. ii will at all times consider whether such interest impairs the objectivity of the recommendation.
In addition, individuals involved in the production of investment articles are subject to a personal account dealing restriction, which prevents them from placing a transaction in the specified instrument(s) for a period before and for five working days after such publication. This is to avoid personal interests conflicting with the interests of the recipients of those investment articles.