Chart of the week: When the rocket runs out of fuel
1st August 2016 10:17
by John Burford from interactive investor
Share on
I have been bullish all year on and last covered it on on 4 July when the shares were trading at the 620 level and this is what I wrote: "The market should continue in this vein unless the Brexit low of 570 is broken. Otherwise, I see no reason to change my bullish stance."
I showed the powerful bull trend off the 2009 lows where pull-backs have been well contained - and provided opportunities for buy the dip strategies. But during July, the shares have rocketed by 15% and are today trading over the £7 level.
But what is interesting is the nature of the bull run off the 2009 lows. Here is the monthly chart:
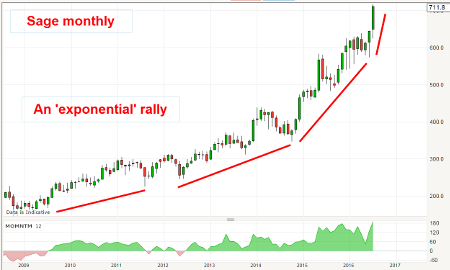
Broadly, the trend has been accelerating at steeper rates in what is termed an 'exponential' rally. And now, the uptrend is near-vertical.
Whenever we see such an exponential rise, we can be pretty sure of one thing: when the rocket has run out of fuel, the decline will be equally rapid.
Outlook
Traders/investors who wish to adhere to the Buy Low, Sell High school should start looking at an exit strategy from now on, but the eventual top may be some distance away.
Shell hits the £20 target zone I set in February
Cast your mind back to February when crude oil was in a severe bear trend and was trading down at the $30 level. Most observers were calling for a further decline down to $25, or $20, or even $15. Those were dark days for crude and also for the oil majors, such as , but they were also days when contrary thinking provided rich pickings.
In my COTW of 15 February, I expressed the opposite opinion; that crude oil was setting up for a major rally phase, as was Shell. What was my evidence for this contrary forecast? This was the daily chart I showed then:
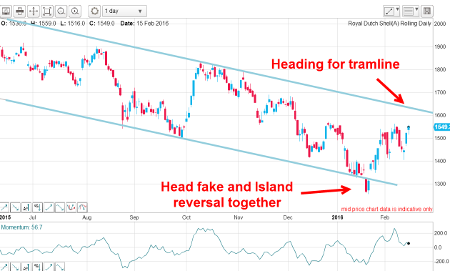
I pointed out the textbook 'head fake' and island reversal pattern in January below the £13 area. A head fake is where the market breaks a tramline for a day or two but then scoots back inside the trading channel as if it realises its mistake and compensates for its error by moving sharply in the other direction (in this case, up).
And an island reversal is where there is a gap on both sides of the candlestick at the extreme low of the move. It signals selling exhaustion.
I mentioned that my next target was the upper tramline in the £16 area and that breaking above that would set up a higher target. This is what I wrote then: "If last week's low in crude oil holds for weeks and months, Shell should test my upper tramline in the 1600 area very soon. A sharp break above my upper tramline will bring into play my next major target in the 2000 area."
And here is the weekly chart updated:
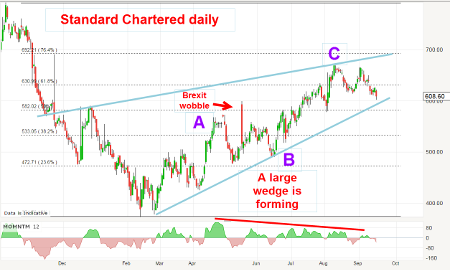
From the 2014 high at the £25 level, the market descended in a clear five down impulsive pattern to the January low near £12. With that knowledge in February and with the head fake/island reversal pattern on the daily chart, I was able to make a high probability forecast - that the £20 area was likely to be reached.
And since February, the market has rallied in a clear three-wave A-B-C pattern, which is textbook of course.
In fact, as a bonus, the market slightly over-shot the Fibonacci 62% resistance level to the £21.50 level which offered an excellent profit-taking opportunity of the 50% gain.
Serco slowly gets up off the floor
I last covered Serco on 13 June and noted the Serco Wedge that had formed at the lows. This is a very reliable pattern that usually heralds a major reversal.
This was the chart I showed then:
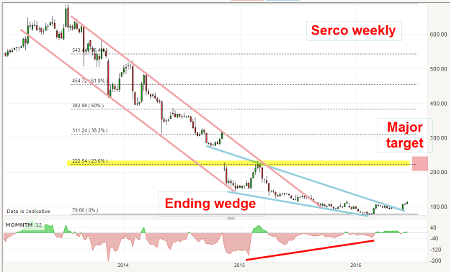
The blue lines describe the wedge and the market had just broken up out of it in a bullish display.
As I pointed out, sentiment towards the shares had been very bearish, but the wedge break was signaling that this was about to change. I had a target zone in the 220 - 240 zone, which is the Fibonacci 23% retrace of the wave off the 2015 high. On June 13, the shares were trading at the 113 level and today, they are at 120. Interim results are due this week.
But sentiment remains highly bearish if yesterday's Sunday Times article is anything to go by where the advice is to 'stay well clear'. And that is the kind of sentiment that can fire the emerging rally! In fact, it is a pre-requisite.This article is for information and discussion purposes only and does not form a recommendation to invest or otherwise. The value of an investment may fall. The investments referred to in this article may not be suitable for all investors, and if in doubt, an investor should seek advice from a qualified investment adviser.
These articles are provided for information purposes only. Occasionally, an opinion about whether to buy or sell a specific investment may be provided by third parties. The content is not intended to be a personal recommendation to buy or sell any financial instrument or product, or to adopt any investment strategy as it is not provided based on an assessment of your investing knowledge and experience, your financial situation or your investment objectives. The value of your investments, and the income derived from them, may go down as well as up. You may not get back all the money that you invest. The investments referred to in this article may not be suitable for all investors, and if in doubt, an investor should seek advice from a qualified investment adviser.
Full performance can be found on the company or index summary page on the interactive investor website. Simply click on the company's or index name highlighted in the article.
Disclosure
We use a combination of fundamental and technical analysis in forming our view as to the valuation and prospects of an investment. Where relevant we have set out those particular matters we think are important in the above article, but further detail can be found here.
Please note that our article on this investment should not be considered to be a regular publication.
Details of all recommendations issued by ii during the previous 12-month period can be found here.
ii adheres to a strict code of conduct. Contributors may hold shares or have other interests in companies included in these portfolios, which could create a conflict of interests. Contributors intending to write about any financial instruments in which they have an interest are required to disclose such interest to ii and in the article itself. ii will at all times consider whether such interest impairs the objectivity of the recommendation.
In addition, individuals involved in the production of investment articles are subject to a personal account dealing restriction, which prevents them from placing a transaction in the specified instrument(s) for a period before and for five working days after such publication. This is to avoid personal interests conflicting with the interests of the recipients of those investment articles.