Chart of the week: Take profits before BHP's results?
15th August 2016 11:46
by John Burford from interactive investor
Share on
I have been covering since the winter lows at around £6 in January, when I explained that the market's slide was almost certainly coming to an end, based on the chart wave patterns I had found. Remember, this was when sentiment towards commodities was in the pits and commodity shares such as BHP were probably among the least-loved on the board.
Not that there was a shortage of hated shares back then. This was the time when stockmarkets were in free-fall as fears the Chinese economy would implode were rife.
In fact, the general indices continued falling in January and made major lows the following month. But because of the BHP's wave pattern, it appeared likely that commodity shares were about to turn up ahead of the FTSE 100. This was the chart I showed on 4 January:
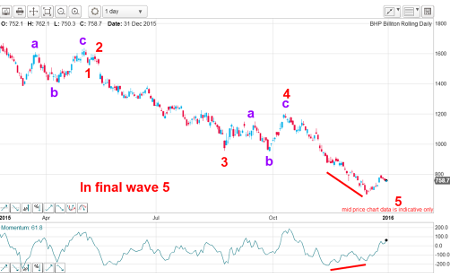
The market was close to completing wave five and probably had one more up/down sequence to put in the final bottom. And the market duly obliged and made that new low at around the $6 level. This was the updated chart I showed in my Chart of the week of 22 February:
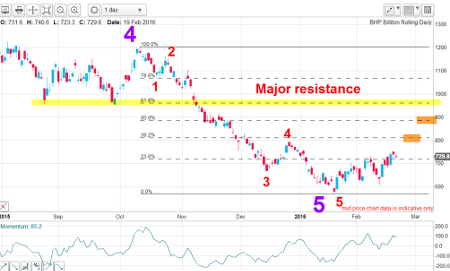
So the January low completed both red and purple fifth waves and was turning back up. I had my initial targets at £8 and then £9 set. And since then, these targets have been reached.
Here is the weekly chart updated to Friday:
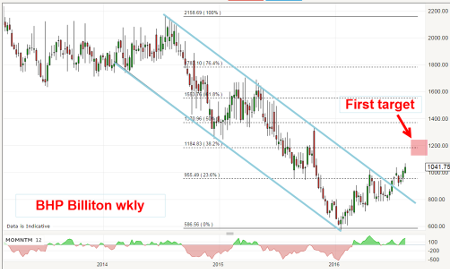
Now, I have a terrific tramline pair working with very accurate touch points on both lines. These lines are very solid lines of support (upper and lower). Remember, when the market trades under the upper tramline, it is a line of resistance. When the market breaks above it, it becomes a line of support.
So with the upper tramline break in late June, the shares have been confirming that bullish event by moving higher with the generally bullish tone to commodity prices. In fact, iron ore prices have been very firm of late - and that has surprised many pundits, given the apparent sharp stockpile build-up in China.
Let's zoom in on recent action. Here is the daily:
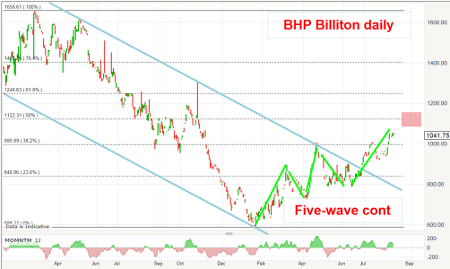
The feature that stands out is the five-wave continuation pattern between the tramlines. This is a fairly common pattern that appears as a zig-zag with overlapping waves. It is not to be confused with a five-wave impulse pattern.
And one of its most useful features is that it can be used to forecast a price target. Because it usually lies about half-way along a wave, I can place this target at roughly the same place as the Fibonacci 50% retrace of the wave off the March 2015 high.
That sets my double target in the £11 region. Remember, I also have a £12 target working (top chart).
If this first target is reached, it would hit the doubly strong resistance there and set up a possible reversal. Keep in mind that the shares remain in a long-term bear trend and the rally off the January low is very likely only a bear market rally.
We know that bear market rallies usually take the form of an A-B-C three-wave affair, and this knowledge can provide me with a likely roadmap for the medium term.
If the market does make a turn down between now and the £11 target, that would be wave A. A decline from there would be wave B and then a resurgent market would put in the final C wave, which would likely exceed the A wave high and possibly make it to my £12 target. That certainly would be a very pretty result.
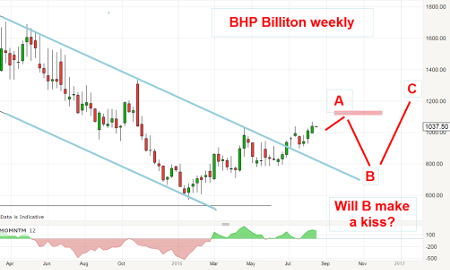
This is what the weekly chart could look like:
Wave B could descend to the upper tramline around the £8 region to plant a traditional kiss before moving back up in wave C at around £12.
Latest company results will be released tomorrow and most are expecting heavy losses. But has this been priced in already? That is always the question! We shall find out tomorrow, I am sure.
But with the shares trading very near my ideal £11 target and anticipating the A wave high, prudence suggests taking at least some profits off the table ahead of results. And from the £7 level, that is a tidy gain of 50%.
This article is for information and discussion purposes only and does not form a recommendation to invest or otherwise. The value of an investment may fall. The investments referred to in this article may not be suitable for all investors, and if in doubt, an investor should seek advice from a qualified investment adviser.
These articles are provided for information purposes only. Occasionally, an opinion about whether to buy or sell a specific investment may be provided by third parties. The content is not intended to be a personal recommendation to buy or sell any financial instrument or product, or to adopt any investment strategy as it is not provided based on an assessment of your investing knowledge and experience, your financial situation or your investment objectives. The value of your investments, and the income derived from them, may go down as well as up. You may not get back all the money that you invest. The investments referred to in this article may not be suitable for all investors, and if in doubt, an investor should seek advice from a qualified investment adviser.
Full performance can be found on the company or index summary page on the interactive investor website. Simply click on the company's or index name highlighted in the article.
Disclosure
We use a combination of fundamental and technical analysis in forming our view as to the valuation and prospects of an investment. Where relevant we have set out those particular matters we think are important in the above article, but further detail can be found here.
Please note that our article on this investment should not be considered to be a regular publication.
Details of all recommendations issued by ii during the previous 12-month period can be found here.
ii adheres to a strict code of conduct. Contributors may hold shares or have other interests in companies included in these portfolios, which could create a conflict of interests. Contributors intending to write about any financial instruments in which they have an interest are required to disclose such interest to ii and in the article itself. ii will at all times consider whether such interest impairs the objectivity of the recommendation.
In addition, individuals involved in the production of investment articles are subject to a personal account dealing restriction, which prevents them from placing a transaction in the specified instrument(s) for a period before and for five working days after such publication. This is to avoid personal interests conflicting with the interests of the recipients of those investment articles.