Chart of the week: Shares in a crucial zone
22nd August 2016 11:32
by John Burford from interactive investor
Share on
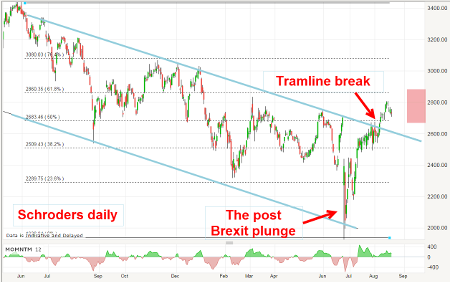
Schroders recovers from Brexit swoon
I last covered on the Monday before the historic Brexit vote on 23 June and noted the market was highly volatile and emotional, even before the result was announced a few days later.
As the poll results swung from the 'In' camp to the 'Out' camp the market, along with many other shares, zig-zagged wildly and this was the chart I showed then:

And this is what I wrote:
"To me, this is a clear demonstration of a highly emotional market and in such circumstances usually reliable chart patterns are often violated. And that is why I decided to reduce trading activity.
"But the fog will probably clear after the referendum and when it does, I am confident the chart patterns will be readable once more."
Note, that in my view of the supreme importance of the referendum result, my stance was to cut trading positions ahead of the vote. I still believe this was the prudent course of action.
But I also said that in all likelihood, the chart pattern would become readable once more in the days and weeks after 23 June.
So what could the market do that would trigger a tradable event in my system?
I had a very solid blue line of resistance with three very accurate touch points. According to my tramline method, a buy signal would be given if the market could break above this line. So that was the prize.
However, when the Brexit result was announced, the shares plunged to below £20 in panic selling. So many traders/investors had geared up for an 'In' result, they were simply shocked into panic selling on the 24th.
Of course, with hindsight it was possible to step in and buy on this plunge and that has had a good result so far, but that action lies outside my methods. Sometimes this works and sometimes it leads to disaster (as in the great wipe-out of 2007/2009).
If you do try to catch a falling knife (as this method is called), any protective stop you may use is likely to be taken out which makes the risk/reward ratio too high for my liking.
But there was some measure of where the low was likely to be on the highly emotional Friday - and that was near my lower blue tramline support around the £20 area. As it happened, that was the area of the panic low.
But when a little sanity was restored and Brexit was seen not to be a disaster end-of-the-world scenario for UK shares, they started a strong recovery and earlier this month, they powered above my upper tramline creating a buy signal.
But now the shares are trading at the crucial zone between the Fibonacci 50% and 62% retrace levels. Odds favour a pull-back to at least plant a kiss on the upper tramline in the £26 area. After that - I need to see the wave pattern to hand me clues.
Weir Group heads for my £18 target
When I last covered major oil services group on 2 May, crude oil was starting a vigorous (and totally dis-believed) rally. Sentiment in the oil sector was improving slightly but from very bearish levels. This is a situation I love to trade.
This was the long-range chart I showed then:
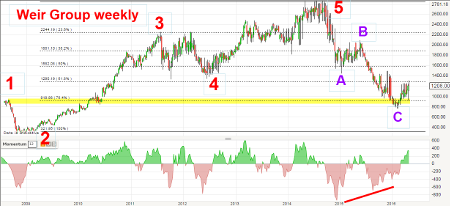
I had identified a lovely multi-year textbook five up/three down where the C wave had hit support at the Fibonacci 78% support level on a large momentum divergence and was making some upside progress. The question was: Would the rally be sustained?
This is what I wrote then:
"With crude oil in a vigorous short squeeze rally, Weir should make it to my tramline, but then should encounter stiff resistance. That will be the critical test of the rally. If it can move above it with force, the £18 area becomes my immediate target."
The tramline I referred to was the upper blue line here on the weekly chart:
And here is the weekly chart updated to today:
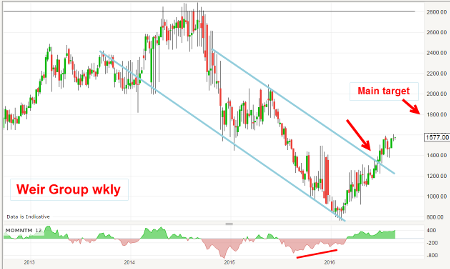
My upper tramline was penetrated just after the Brexit vote result and has continued moving up and is within striking distance of my main £18 target, which is a Fibonacci 50% retrace of the entire wave down off the 2014 highs. I have higher targets as and when £18 is achieved.
This article is for information and discussion purposes only and does not form a recommendation to invest or otherwise. The value of an investment may fall. The investments referred to in this article may not be suitable for all investors, and if in doubt, an investor should seek advice from a qualified investment adviser.
These articles are provided for information purposes only. Occasionally, an opinion about whether to buy or sell a specific investment may be provided by third parties. The content is not intended to be a personal recommendation to buy or sell any financial instrument or product, or to adopt any investment strategy as it is not provided based on an assessment of your investing knowledge and experience, your financial situation or your investment objectives. The value of your investments, and the income derived from them, may go down as well as up. You may not get back all the money that you invest. The investments referred to in this article may not be suitable for all investors, and if in doubt, an investor should seek advice from a qualified investment adviser.
Full performance can be found on the company or index summary page on the interactive investor website. Simply click on the company's or index name highlighted in the article.
Disclosure
We use a combination of fundamental and technical analysis in forming our view as to the valuation and prospects of an investment. Where relevant we have set out those particular matters we think are important in the above article, but further detail can be found here.
Please note that our article on this investment should not be considered to be a regular publication.
Details of all recommendations issued by ii during the previous 12-month period can be found here.
ii adheres to a strict code of conduct. Contributors may hold shares or have other interests in companies included in these portfolios, which could create a conflict of interests. Contributors intending to write about any financial instruments in which they have an interest are required to disclose such interest to ii and in the article itself. ii will at all times consider whether such interest impairs the objectivity of the recommendation.
In addition, individuals involved in the production of investment articles are subject to a personal account dealing restriction, which prevents them from placing a transaction in the specified instrument(s) for a period before and for five working days after such publication. This is to avoid personal interests conflicting with the interests of the recipients of those investment articles.