Chart of the week: Randgold set for short-term shine
5th September 2016 10:24
by John Burford from interactive investor
Share on
Has Randgold made its high for 2016?
This was the headline in my 25 July Chart of the week as gold and its major miners reached for the stars - as the bulls were hoping. Since then, has moved off its £98 high to last week's low of £70: a loss of a third. Ouch!
So how did I manage to pinpoint this major turn when most were looking up to the heavens?
Recall, I started getting interested in the 'buy' side of both gold and the miners back in the Winter. Back then, precious metals and the miners were thoroughly hated as most pundits were confidently forecasting gold would soon plunge below the $1,000 mark, and that miners would tag along the down escalator. Today, the situation is the reverse.
But, of course, that extreme bearish sentiment got my antennae twitching like mad - and I caught the lows and rode most of the ensuing bull run, with Randgold moving from the Winter doldrums of around £40 to the July high of near £100.
This was the chart I showed in July:
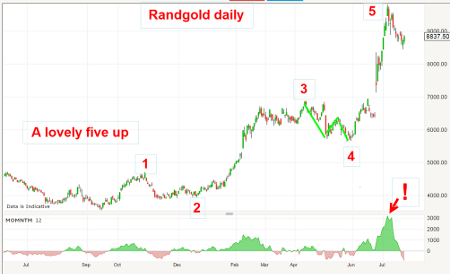
I noted the near-textbook five up Elliott wave pattern with the final fifth wave highly extended - this is typical in commodity-based charts - and the peak was reached on a highly extended momentum reading.
This was the July chart of the fifth wave:
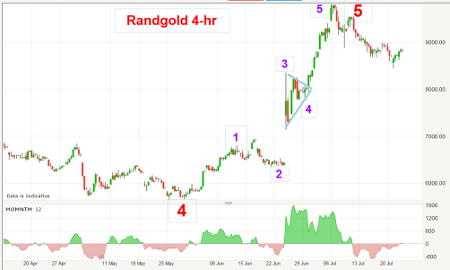
The dramatic post-Brexit gap higher was my third wave and then a lovely triangle in wave 4 and the slight momentum divergence going into the final £98 high on 6 July.
This is what I wrote:
With a complete five up on two degrees of scale, odds are good that a new downtrend has started. The first target is the purple wave 4 low at the £80 area.
And if the downtrend becomes established, that large gap at the £70 area looms as a target. Longer-term, I have a major support target at the £58 area.
Remember, I was writing only a few days after the £98 print and most were forecasting moves to well over the "magical" £100 level. Experienced traders will know that there was a certain amount of intestinal fortitude involved in making that forecast. There always is when you go public against majority opinion - and the larger trend. But a reading of the Elliott waves gave the correct forecast.
Most analysts are unable to pick tops in a highly trending bull market - and vice versa - and that is why you often read the advice "Nobody can pick tops and bottoms - just go with the trend".
Anyone who bought Randgold in June near £80 (as they were now confident of the uptrend) would have seen the shares soar to £98 - and then collapse to £70. From a decent gain to a sizeable loss in days. That is the fate of most investors, isn't it?
Now they have a problem: to fold or twist.
So let's see how the market has performed to date:
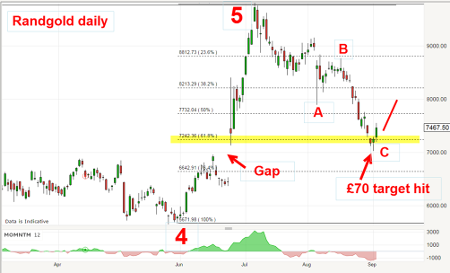
As gold has declined from its July high at $1,375 to last week's low of $1,302, the shares have been hit very hard. But on Friday, the US non-farms was used as an excuse to see some short covering and right on cue, the shares rebounded from meeting the gap produced by the Brexit effect.
Gaps are very important chart features. That gap in the share chart stands out as highly significant because the move on the day after Brexit on 24 June took out major buy-stops above the £70 level in one fell swoop and at one time during the day, the market zoomed up from £64 to £84! In a FTSE 100 company, that is notable.
So how did a trader perform using my methods? Shares were bought near the £40 level last winter to be sold near the £90 level in July. They were then shorted and profits taken near £70 last week for a combined profit of £70 a share. Not too shabby.
But were they a buy again last week?
Outlook
The market has fallen to the upper edge of the gap and the Fibonacci 62% retrace of wave five. That is major support. The decline has a clear A-B-C feel, so far, and that is a corrective pattern. Odds favour at least a decent bounce from the £70 level to at least the £80 area.
But upside progress from there will be hard-won. As I mentioned last winter, the gold miners are not "set and forget" investments; they are trading vehicles where the ideal holding period is measured in weeks, not months/years. They are ideal for my swing trading approach.
I am launching my new VIP Pro Share Service later this month, which will highlight promising setups for both spreadbetters and longer-term investors. Details forthcoming.
This article is for information and discussion purposes only and does not form a recommendation to invest or otherwise. The value of an investment may fall. The investments referred to in this article may not be suitable for all investors, and if in doubt, an investor should seek advice from a qualified investment adviser.
These articles are provided for information purposes only. Occasionally, an opinion about whether to buy or sell a specific investment may be provided by third parties. The content is not intended to be a personal recommendation to buy or sell any financial instrument or product, or to adopt any investment strategy as it is not provided based on an assessment of your investing knowledge and experience, your financial situation or your investment objectives. The value of your investments, and the income derived from them, may go down as well as up. You may not get back all the money that you invest. The investments referred to in this article may not be suitable for all investors, and if in doubt, an investor should seek advice from a qualified investment adviser.
Full performance can be found on the company or index summary page on the interactive investor website. Simply click on the company's or index name highlighted in the article.
Disclosure
We use a combination of fundamental and technical analysis in forming our view as to the valuation and prospects of an investment. Where relevant we have set out those particular matters we think are important in the above article, but further detail can be found here.
Please note that our article on this investment should not be considered to be a regular publication.
Details of all recommendations issued by ii during the previous 12-month period can be found here.
ii adheres to a strict code of conduct. Contributors may hold shares or have other interests in companies included in these portfolios, which could create a conflict of interests. Contributors intending to write about any financial instruments in which they have an interest are required to disclose such interest to ii and in the article itself. ii will at all times consider whether such interest impairs the objectivity of the recommendation.
In addition, individuals involved in the production of investment articles are subject to a personal account dealing restriction, which prevents them from placing a transaction in the specified instrument(s) for a period before and for five working days after such publication. This is to avoid personal interests conflicting with the interests of the recipients of those investment articles.