Chart of the week: Centrica about to rally?
3rd October 2016 12:20
by John Burford from interactive investor
Share on
Is Centrica poised for a further rally?
Long-time sufferers of mine know that I often have terrific fun with mainstream media (MSM) articles on market matters and, especially, monitoring the tone of the headlines to judge market reversals.
And my eyebrows rise when the headlines are especially strident and dramatic. Over the years, I have noted a curious phenomenon that can pinpoint very accurately-timed contrarian trades that prove to be profitable - sometimes hugely so.
In fact, the indicator I have developed is laughably simple. I call it the "headline indicator" (HI). It works particularly well after a trend has been in place for some time, such as , the holding company of British Gas.
This share used to be a "widows and orphans" holding for its steady price performance and dividends, but no more. Since 2013, the shares have been on the down escalator from a high at around 400p to a recent low of under 200p - a loss of greater than 50% in just three years.
Of course, the "reasons" for this loss in value are well rehearsed in the MSM, as energy prices have trended lower and customers have left BG in droves, partly because of poor customer service. Naturally, this negative coverage has weighed on investor sentiment.
In December 2015, Questor tipped Centrica as one to avoid during a commodity downturnQuestor in the Daily Telegraph is one of the most popular newspaper financial analysts and has been going for some decades. It is followed by a great many retail investors as a knowledgeable source of investment information and tips. As such, I like to use it as a "barometer" of popular sentiment.
And in July last year, as the shares had dropped to the 260p area, Questor had an article covering the big job losses and a big increase in BG profits just announced, which offset the big loss on oil and gas exploration and production activities. Interestingly, Questor had no opinion on the shares then. The downtrend remained in place.
In December, Questor ran this headline: "Avoid Centrica as it grapples with commodity downturn". It mentions the pressure on energy bills from competition and the cut in dividend by 30%. That alerted me to a nearby reversal using my trusty HI.
With this definitive advice in the headline, I could now swing my HI into action - and here is the chart to illustrate how it worked in this textbook example:
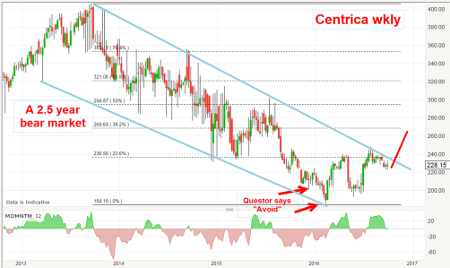
Note that in July, the shares were still falling (with no firm advice from Questor, and so no reason to query the trend), but in December, when Questor firmly said 'avoid', the shares were approaching the 200p level after a 2.5 year bear trend.
Time to look for a reversal after such a well-established trend as a contrarian play.
And then in February, Questor had a headline: "Centrica shares out in the cold after dividend cut" when the shares were trading at the 200p area. "Questor says: 'AVOID'" was the stark inner headline.
Odds were irresistible that the turn was nigh.
Right on cue, the shares started a strong recovery, and within a few months had rallied to the 240p level - a magnificent gain of a third!
A perfect contrarian indicator
How's that for timing? Questor was, once again, an almost perfect contrarian indicator! Yes, I will grant that Questor lays out a perfectly rational analysis using fundamental data that is hard to argue with. But the rally off the low lays bare the basic problem with fundamental analysis: it pays no attention to the internal dynamics of the actual share market - and the chart history.
When bearish sentiment is so strong, all it takes is a very little buying to rally the sharesJust as Questor became most bearish in February - and was herding along with most investors - that was the point where bearish sentiment had reached its zenith. There was no more downside available - most of the bulls had either sold out or had decided to hold on.
And that laid the ground for a little bargain hunting (and short-covering) to rally the market. When bearish sentiment is so strong, all it takes is a very little buying in order to rally the shares.
Just as the bearish chorus on commodities had reached a peak in February, that was also the commodity low, especially in crude oil. From a low of around $28 in US Crude, the market has rallied to a recent $48 level. And, still, many cling to last year's story of 'plunging' commodity prices caused by "over-supply".
So today, Centrica shares are poised close to my upper tramline (see chart above). And note that this tramline possesses multiple accurate touch points, making it a very reliable line of resistance.
Any poke above that line (prompted by a further crude oil rally, perhaps?) should set off many stop losses and the shares could run quickly up to the Fibonacci 38% level around 270p.
So thank you Questor - you have provided a most valuable service!
A reminder that I have launched my VIP PRO SHARES service and have started trading. It is aimed at both spread betters and investors alike and I am offering a three week Free Trial for you to road-test it. For full details, please go to my website.
This article is for information and discussion purposes only and does not form a recommendation to invest or otherwise. The value of an investment may fall. The investments referred to in this article may not be suitable for all investors, and if in doubt, an investor should seek advice from a qualified investment adviser.
These articles are provided for information purposes only. Occasionally, an opinion about whether to buy or sell a specific investment may be provided by third parties. The content is not intended to be a personal recommendation to buy or sell any financial instrument or product, or to adopt any investment strategy as it is not provided based on an assessment of your investing knowledge and experience, your financial situation or your investment objectives. The value of your investments, and the income derived from them, may go down as well as up. You may not get back all the money that you invest. The investments referred to in this article may not be suitable for all investors, and if in doubt, an investor should seek advice from a qualified investment adviser.
Full performance can be found on the company or index summary page on the interactive investor website. Simply click on the company's or index name highlighted in the article.
Disclosure
We use a combination of fundamental and technical analysis in forming our view as to the valuation and prospects of an investment. Where relevant we have set out those particular matters we think are important in the above article, but further detail can be found here.
Please note that our article on this investment should not be considered to be a regular publication.
Details of all recommendations issued by ii during the previous 12-month period can be found here.
ii adheres to a strict code of conduct. Contributors may hold shares or have other interests in companies included in these portfolios, which could create a conflict of interests. Contributors intending to write about any financial instruments in which they have an interest are required to disclose such interest to ii and in the article itself. ii will at all times consider whether such interest impairs the objectivity of the recommendation.
In addition, individuals involved in the production of investment articles are subject to a personal account dealing restriction, which prevents them from placing a transaction in the specified instrument(s) for a period before and for five working days after such publication. This is to avoid personal interests conflicting with the interests of the recipients of those investment articles.