A stock in one chart: Has Barratt peaked?
20th October 2016 10:43
by Sharepad from interactive investor
Share on
Shareholders in housebuilding companies have done very nicely over the past few years. They have experienced sharply rising share prices and bumper dividends as the sector's profits have soared.
With considerable assistance from the government's Help to Buy Scheme since 2013, the builders have been selling more houses at higher prices. When this has been combined with the smart buying of land to build on at favourable prices it is no surprise that profit margins have risen a lot.
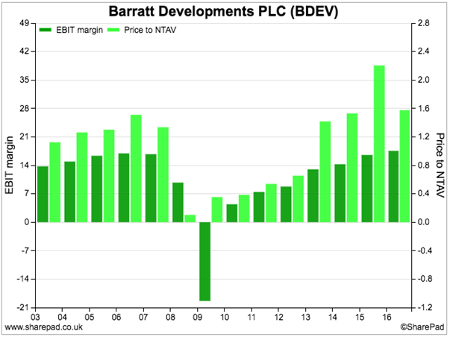
We can see from the darker bars in the chart below that profit margins are now at similar levels to those achieved at the peak of the last housing market boom in 2007. The question that shareholders need to ask is: can margins go any higher, or is this as good as it gets?
Nobody can be sure, but there are grounds for caution. House price inflation is showing signs of slowing down whilst affordability for buyers remains stretched.
That said, builders such as Barratt are sitting on land banks that have some very cheap land in them. As long as house prices do not fall, this should help margins stay near their recent highs.
But there is another thing for investors to consider - the valuation of housebuilding shares. The most popular measure is price to net tangible asset value (P/NTAV) where most of the assets are in the form of land.
The lighter bars above show Barratt's historic P/NTAV. You can see that it tends to move in the same direction as profit margins. You can also see that on this measure, the shares are more expensive than the last peak in 2007.
So we have a combination of peak profit margins and close to peak valuations. What this is telling investors is a lot of the easy money has been made from this sector and it might be difficult for share prices to move sustainably higher.
It might also go some way to explaining why housebuilders - with the exception of - have not made any money for investors during the last year.
The ii view:
Housebuilders were among the hardest hit in the post-referendum crash, and they've been among the slowest to recover. That this is the case, despite knockout dividend yields and embarrassingly low price/earnings (PE) multiples, is indicative of investor sentiment.
A P/NTAV of around 1.5 for 2017 is certainly not the loftiest valuation in the sector, either, but there is better value elsewhere. If you believe a housing market crash is inevitable, or are fearful of Brexit, you'll steer clear of the sector completely. Either way, a substantial rally from here appears unlikely right now.
Read more from Phil Oakley here. Financial charts are a feature of SharePad, the web-based service from ShareScope. Voted UK's Best Investment Software 2015. For a limited period, you can get a three month subscription to SharePad for just £25.
This article is for information and discussion purposes only and does not form a recommendation to invest or otherwise. The value of an investment may fall. The investments referred to in this article may not be suitable for all investors, and if in doubt, an investor should seek advice from a qualified investment adviser.