Chart of the week: Mining rally not over
24th October 2016 11:04
by John Burford from interactive investor
Share on
BHP Billiton hits both of my targets, but is there more?
Suddenly, the mining giants, including , are hot again. Yes, indeed, from zero last winter to hero today. In these pages, I have mapped the terrific rise in these shares from the lows in February when all mining shares were among the most hated on the planet, to my last coverage on 15 August.
So, today, I will update you with the glad tidings that my targets of £11 and £12 have been met - targets I laid out for you back in August. But, remember, my targets are just that - targets to be hit. They are not necessarily where markets make major turns - there may be other targets to aim for once the first ones have been met.
So why did the shares make a major turn up back in February when just about everyone was herding into the bears' camp?
For one thing, that amazing commodity - coal - made its low then and started a near-vertical rise - much to almost everyone's surprise. Here is the chart:
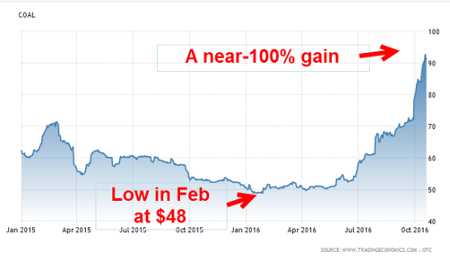
In fact, it has almost doubled in price! Remember, this is the most hated energy source on/in the planet. According to some, it is pure evil, as conventional "wisdom" has it that it is largely responsible for "global warming".
This is not the place to elaborate on this myth*, but it is a fact that most Western governments have slapped a very heavy tax on coal-fired power stations while showering immense subsidies on "green" energy sources such as wind and solar. Never mind that China and India have yet to see the light.
Yes, the accepted theme is that coal is on its way out, and prices must fall, no? And if you base your investment decisions on herding with the followers of received wisdom, you will have missed several terrific profitable opportunities. Here is the chart of the , which is a popular collection of coal-related company shares:
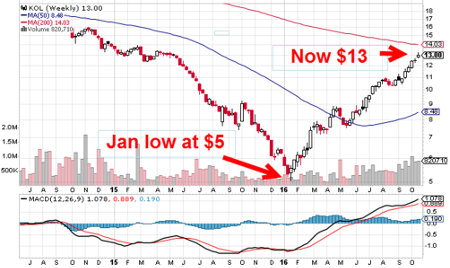
The shares have rocketed from a low of $5 in January to today's quote of $13 - a mammoth gain of 160%. And now the shares are rapidly approaching the 200-day moving average and we should see at least a pause in the ascent.
But the fact is that very few saw that coming - and highlights yet again how dangerous it can be to believe the obvious conclusions in the world of finance. As that famous trader Joe Granville once said: "When everyone believes something is obvious, it is obviously wrong".
And not only did coal take part in the "surprise" reversal in the commodity bear trend, here is iron ore - a commodity of which BHP is a very large producer and for which the sentiment had turned very bearish last winter.
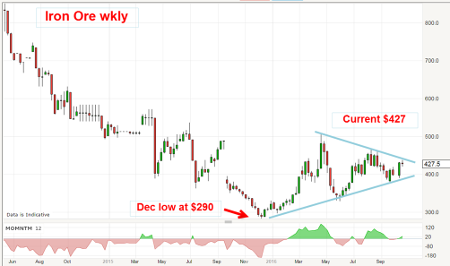
Iron ore prices have rallied from the December low at $290 to today's $427 - a solid gain of almost 50%. That wasn't expected by very many last winter.
With sentiment towards most commodities at rock bottom last winter, BHP shares had been hit hard - and presented a massive buying opportunity, as I wrote at the time.
Here is the chart I showed back in August when the rally was in full spate:
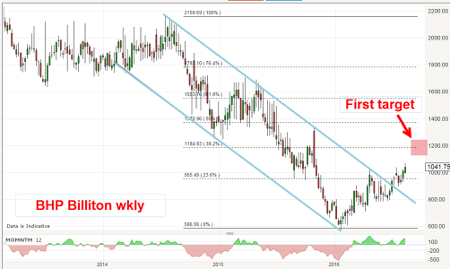
From the Fibonacci levels I placed on the entire bear trend off the 2014 high, I reckoned a reasonable target was on or near the Fibonacci 38% level at around £12.
This is what I wrote in August:
If the market does make a turn down between now and the £11 target, that would be wave A. A decline from there would be wave B and then a resurgent market would put in the final C wave, which would likely exceed the A-wave high and possibly make it to my £12 target. That certainly would be a very pretty result.
Let's see if the market did make that A-B-C pattern and hit my £12 target. Here is the updated daily chart:
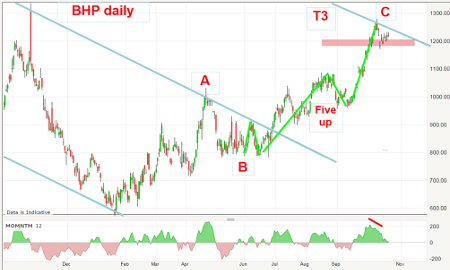
The answer is yes to both counts. The A-B-C pattern is pretty clear and my £12 target was hit a few days ago with an overshoot to the £12.80 high.
Not only that, but I have a nice "five up" in wave C which has likely not yet ended. In addition, it has hit my third tramline (T3) which is drawn equidistant from the main tramline pair. Always, T3 is a potential resistance level.
The bottom line? The market has hit several resistance levels and is due at least a pause in its ascent. But if the market can smash up past the £12 area resistance soon, I have another target at around the £14 level, which is the Fibonacci 50% retrace of the wave down off the 2014 high.
One final thought: I have labelled the recovery as a corrective A-B-C, but what if the market is really in a "five up" impulsive wave? If so, we are currently in a third wave - and third waves are usually long and strong. And that would set my targets much, much higher. Hmm.
*The views expressed here are those of the author and do not necessarily represent or reflect the views of Interactive Investor
This article is for information and discussion purposes only and does not form a recommendation to invest or otherwise. The value of an investment may fall. The investments referred to in this article may not be suitable for all investors, and if in doubt, an investor should seek advice from a qualified investment adviser.
These articles are provided for information purposes only. Occasionally, an opinion about whether to buy or sell a specific investment may be provided by third parties. The content is not intended to be a personal recommendation to buy or sell any financial instrument or product, or to adopt any investment strategy as it is not provided based on an assessment of your investing knowledge and experience, your financial situation or your investment objectives. The value of your investments, and the income derived from them, may go down as well as up. You may not get back all the money that you invest. The investments referred to in this article may not be suitable for all investors, and if in doubt, an investor should seek advice from a qualified investment adviser.
Full performance can be found on the company or index summary page on the interactive investor website. Simply click on the company's or index name highlighted in the article.
Disclosure
We use a combination of fundamental and technical analysis in forming our view as to the valuation and prospects of an investment. Where relevant we have set out those particular matters we think are important in the above article, but further detail can be found here.
Please note that our article on this investment should not be considered to be a regular publication.
Details of all recommendations issued by ii during the previous 12-month period can be found here.
ii adheres to a strict code of conduct. Contributors may hold shares or have other interests in companies included in these portfolios, which could create a conflict of interests. Contributors intending to write about any financial instruments in which they have an interest are required to disclose such interest to ii and in the article itself. ii will at all times consider whether such interest impairs the objectivity of the recommendation.
In addition, individuals involved in the production of investment articles are subject to a personal account dealing restriction, which prevents them from placing a transaction in the specified instrument(s) for a period before and for five working days after such publication. This is to avoid personal interests conflicting with the interests of the recipients of those investment articles.