Chart of the week: FTSE 100's 'very reliable' line of support
7th November 2016 13:38
Is the FBI manipulating the market?
Just when you thought there could be no more surprises in the US election campaigns, up pops the FBI again and puts Hillary leading by a head. Naturally, that goosed global stockmarkets and crushed gold and rallied the dollar overnight.
You have to wonder if they have a trading room at HQ.
On Friday, the descended to the 6,650 level after days of declines. But that is where I have a major line of support. Here is the chart I prepared on Friday:
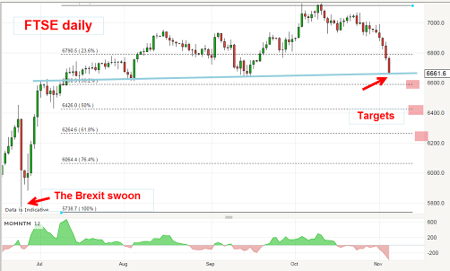
Friday's low is the fourth touch point on this blue line which also sports a "prior pivot point" in early July. According to my tramline trading rules, this is a very reliable line of support. But if it gives way, it will become a line of resistance with downside targets marked.
Only a month ago, the FTSE was pushing above the 7,100 level and so had lost 450 points, or about 6%. But what about 6,650, where I have my major line of support?
This morning, that line is holding, with FTSE bouncing off it in fine style. Of course, tomorrow's election should stir up the emotions even more into Wednesday (and beyond) and very likely produce even more wild swings.
So much is being written about what effect either Hillary or "The Donald" prevailing will have on the markets. A lot of ink is being spilled by earnest gurus on the subject. Remember pre-Brexit when the very same experts were confidently predicting a Remain win and a market rally?
We may see a repeat of the 'Brexit effect', where shares dropped hard, then screamed higherWe got the wipe-out first and then the rally. How many predicted that outcome?
I pay little heed to such analysis and rely on chart pattern-reading combined with sentiment analysis. In the end, that is what drives the markets.
Although there could be very high emotions surrounding the election result (especially if Donald Trump prevails) and rapid and large swings could be on the cards, we could see a repeat of the "Brexit effect", where shares dropped hard only to find a base before screaming higher and higher. The Elliott wave pattern suggests this is a possibility.
That is because the form of the decline off the top is in three waves so far, and this is characteristic of a correction, not the main trend, which is up.
Of course, if the market can break hard below my blue line of support in the days ahead, that interpretation would be less likely and we should be seeing a five-wave down pattern – and here is an example of what I mean.
Amazon traces out a five-down
Last week, I covered the story and showed that the 7% plunge on 27 October was a significant event - and almost certainly signalled a turnaround of the bullish trend that had been in place for years.
Today I want to offer more evidence that this indeed is the case which has been revealed in last week's price action.
Remember, this share has been one of the "FAANG" quintet of tech companies that has driven the NASDAQ to its all-time high in recent weeks.
In fact, it has been calculated that the FAA trio of Amazon, and has accounted for 20% of the entire NASDAQ 100 index gain so far this year. There are few generals, but many soldiers. Odds are that unless you hold any of these shares, any of the other Nasdaq 100 issues could be under water.
This is the chart showing the incredible rise of AMZ since 2002 (most of that time losing much money).
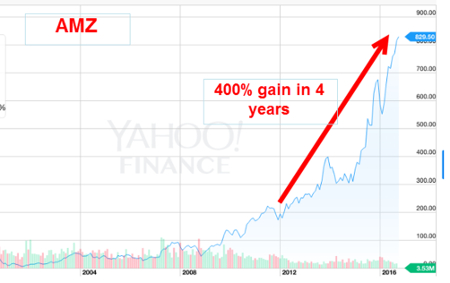
If you squint a little, I am sure you can see five waves up, with wave one reaching $400 in late 2013, wave three at $680 in late 2015 and wave five at the $850 high on 10 October.
On the weekly chart, I have a momentum divergence between waves three and five. So the recent high is a good candidate for a major top - perhaps the all-time top, but that cannot be deduced just yet.
To verify I have a major top, I need to see a small-scale "five waves down" - and I now have one to Friday's $753 low.
I expect a three-wave pattern up which could reach the $800 level and, if there is a clear A-B-C pattern in coming days, I have my first major confirmation that the trend has changed to down and the $850 high will hold.
This article is for information and discussion purposes only and does not form a recommendation to invest or otherwise. The value of an investment may fall. The investments referred to in this article may not be suitable for all investors, and if in doubt, an investor should seek advice from a qualified investment adviser.
These articles are provided for information purposes only. Occasionally, an opinion about whether to buy or sell a specific investment may be provided by third parties. The content is not intended to be a personal recommendation to buy or sell any financial instrument or product, or to adopt any investment strategy as it is not provided based on an assessment of your investing knowledge and experience, your financial situation or your investment objectives. The value of your investments, and the income derived from them, may go down as well as up. You may not get back all the money that you invest. The investments referred to in this article may not be suitable for all investors, and if in doubt, an investor should seek advice from a qualified investment adviser.
Full performance can be found on the company or index summary page on the interactive investor website. Simply click on the company's or index name highlighted in the article.
Disclosure
We use a combination of fundamental and technical analysis in forming our view as to the valuation and prospects of an investment. Where relevant we have set out those particular matters we think are important in the above article, but further detail can be found here.
Please note that our article on this investment should not be considered to be a regular publication.
Details of all recommendations issued by ii during the previous 12-month period can be found here.
ii adheres to a strict code of conduct. Contributors may hold shares or have other interests in companies included in these portfolios, which could create a conflict of interests. Contributors intending to write about any financial instruments in which they have an interest are required to disclose such interest to ii and in the article itself. ii will at all times consider whether such interest impairs the objectivity of the recommendation.
In addition, individuals involved in the production of investment articles are subject to a personal account dealing restriction, which prevents them from placing a transaction in the specified instrument(s) for a period before and for five working days after such publication. This is to avoid personal interests conflicting with the interests of the recipients of those investment articles.
Editor's Picks