Chart of the week: A bank ripe for turning?
28th November 2016 13:00
by John Burford from interactive investor
Share on
My coverage of started many months ago, just as the shares were putting in a major top at the 290p level in the summer of 2015. Since then, the realities of the global finance catastrophe-in-the-making scenario has weighed on the banking sector - and Barclays in particular. Today, I want to explore the likelihood of a major turn in the shares.
The bottom line is that the world is awash with debt - and that debt is still growing, thanks in large part to the actions of the major central banks in their quantitative easing (QE) and zero- or negative-interest rate policies (ZIRP/NIRP).
But recently, a lifeline has been thrown to banking shares from the proposed "Trumponomics" stimulus, just as long-term bond yields are rising.
And this is how the market has adjusted to these major themes:
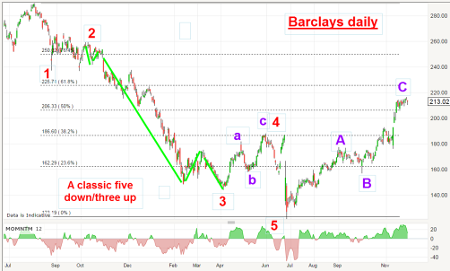
The decline off the 290p high is in five clear Elliott waves, with wave three containing its own "five down" (green bars), which is a requirement for a large impulsive wave.
Wave four up is a three-wave affair - also typical of fourth waves. Finally, wave five is the June Brexit plunge, which was the final selling climax of the "five down". With that pattern in place, the most likely outlook was for a rally of some kind.
Of course, when at the Brexit low of 120p in late June, it was not possible to forecast with any certainty what shape the rally would take. It could be a shallow affair before moving even lower, or it could be the start of a new five-wave impulse wave - or a three-wave A-B-C correction, which was the most likely.
The rally has hit (and slightly exceeded) the Fibonacci 50% retracement of the entire declineIndeed, as the rally developed, I could see that it would not be a quick affair. The element of timescale is important in Elliott wave analysis. In fact, so far the rally has taken about one half - 50% - of the time taken by the decline.
And that figure is a Fibonacci retracement! So if the market turns here, it would fulfil a very neat Fibonacci relationship in time as well as price.
As for price, the rally has hit (and slightly exceeded) the Fibonacci 50% retracement of the entire decline.
And the rally has the appearance of an A-B-C, as marked. So far, so good.
Because the C wave of an A-B-C is a third wave, it is often stronger than the A wave and, gazing at the momentum chart, that is certainly true here.
Also, because it is a third wave, it often contains its own five-wave impulsive pattern.
Here is a close-up of the C wave rally:
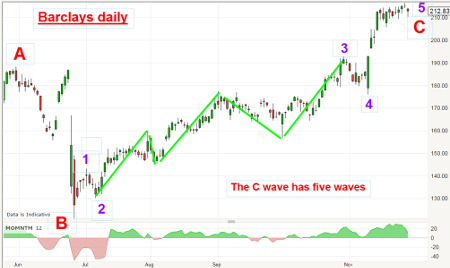
In fact, the C wave not only contains its required five-wave pattern, but the purple third wave likewise contains a lovely impulsive five-up.
So, in Elliott Wave terms, the rally has done enough for us to consider the pattern complete, or nearly so.
But can I pinpoint the place where the turn is likely to occur? I believe I can - here is the two-hour chart:
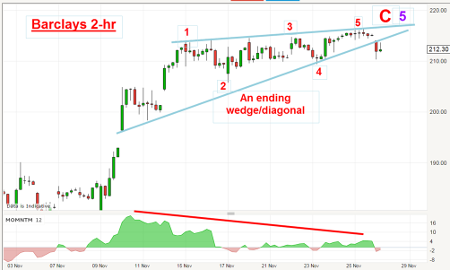
It shows the most recent part of Wave C and, since 11 November, it has been forming a classic wedge (or diagonal) with the usual five waves within. Also, this wedge has formed while the momentum has been falling, thereby creating a momentum divergence which is normal at the end of this pattern.
My immediate targets are the gaps on the way up in the 205p and then the 195p levelsWith this evidence, odds are building that the counter-trend rally high is here, or nearby. This morning, the lower wedge line has been breached, which is usually the first signal that the trend has changed.
If this is correct, my immediate targets are the gaps on the way up in the 205p and then the 195p levels.
What could spoil this picture? Certainly I would put it on hold if the market rallied into new highs above the 220p level. Failing that, there is a low-risk play here if you enter protective buy stops there.
This article is for information and discussion purposes only and does not form a recommendation to invest or otherwise. The value of an investment may fall. The investments referred to in this article may not be suitable for all investors, and if in doubt, an investor should seek advice from a qualified investment adviser.
These articles are provided for information purposes only. Occasionally, an opinion about whether to buy or sell a specific investment may be provided by third parties. The content is not intended to be a personal recommendation to buy or sell any financial instrument or product, or to adopt any investment strategy as it is not provided based on an assessment of your investing knowledge and experience, your financial situation or your investment objectives. The value of your investments, and the income derived from them, may go down as well as up. You may not get back all the money that you invest. The investments referred to in this article may not be suitable for all investors, and if in doubt, an investor should seek advice from a qualified investment adviser.
Full performance can be found on the company or index summary page on the interactive investor website. Simply click on the company's or index name highlighted in the article.
Disclosure
We use a combination of fundamental and technical analysis in forming our view as to the valuation and prospects of an investment. Where relevant we have set out those particular matters we think are important in the above article, but further detail can be found here.
Please note that our article on this investment should not be considered to be a regular publication.
Details of all recommendations issued by ii during the previous 12-month period can be found here.
ii adheres to a strict code of conduct. Contributors may hold shares or have other interests in companies included in these portfolios, which could create a conflict of interests. Contributors intending to write about any financial instruments in which they have an interest are required to disclose such interest to ii and in the article itself. ii will at all times consider whether such interest impairs the objectivity of the recommendation.
In addition, individuals involved in the production of investment articles are subject to a personal account dealing restriction, which prevents them from placing a transaction in the specified instrument(s) for a period before and for five working days after such publication. This is to avoid personal interests conflicting with the interests of the recipients of those investment articles.