Chart of the week: Why the FTSE 100 hasn't topped yet
18th January 2017 12:41
by John Burford from interactive investor
Share on
FTSE is going exponential - until Tuesday
On Friday, the closed higher on the day. Nothing extraordinary about that, since we have been inured to seeing a rising index for some time. But what is extraordinary is the 12-day run of consecutive record highs! That is what I call total complacency to even contemplate the hint of a sharp shock.
If we had a VIX Fear Index on the FTSE as we do on the US S&P 500 index, I am confident it would be plumbing new depths (as is the VIX).
What does that tell me from an Elliott wave perspective? Very simply, it is that the market is in a roaring third wave of some kind.
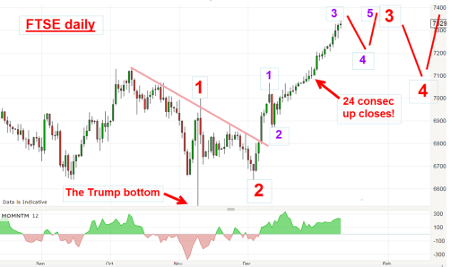
Here are my established and also forecast Elliott wave labels. From the magnificent Trump bottom, I can place wave labels with confidence.
The current period of 24 consecutive up closes has the precise hallmark of a strong third wave within a larger strong third wave - I call it a third of a third. This is among the most relentlessly forceful waves in the book.
I like to say about them that they take no prisoners - in this case, the "prisoners" are the hapless shorts who cannot believe what they are seeing - every day the losses mount higher and higher. I read that George Soros is losing a billion dollars on his shorts - and he is supposed to be a super-trader. Ouch.
Of course, at some stage the market will turn down again to work lower in a fourth wave ('purple') and then stage a 'purple' wave five rally to new highs in the 'red' wave three top. After that, the market will turn down in a larger 'red' wave four and then move higher in the final 'red' wave five before putting in "the top".
Any sharp rally in the pound should put a crimp in the FTSE 100 rallyThat is my forecast - and when can we expect the first correction in that 'purple' wave four?
There are any number of possible timelines - on Thursday the ECB has its monthly meeting and I am sure Draghi's comments about his quantitative easing programme will be closely watched. And then, on Friday, Donald Trump will be inaugurated as US president. Now who forecast that a few short months ago?
If his track record is anything to go by (and it should be), he will provide a few surprises and some will undoubtedly unsettle complacent investors.
One factor sending the FTSE higher is the positive sentiment surrounding the weaker pound that will translate into larger profits from dollar earnings, or so the story goes.
If this is true, any sharp rally in the pound should put a crimp in the FTSE rally. I shall be watching for a rally off the 1.20 low.
Burberry fashions a solid rally
It has been many months since I covered , which has been in a strong rally for several months. It is tracing out wonderful chart patterns that are object lessons in chart-reading.
Here is the weekly:
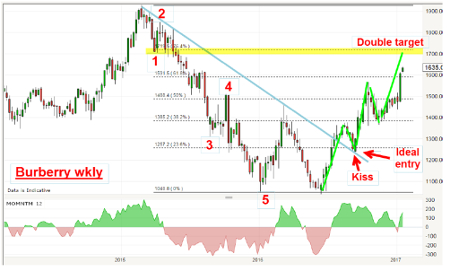
The decline off the 2015 high at £19 is in a clear five-wave pattern with a long and strong third wave. Then a rally and a correction to the £10.50 low in June, which matched the previous low.
That produced a classic "double bottom" which heralded a substantial rally. That information was enough to go looking for a long trade.
It has pushed above the Fibonacci 62% resistance, heading for major resistance in the £17 areaAnother long signal was provided when the rally broke above the blue trendline, but an even better classic entry was given when the shares pulled back to plant a traditional kiss on the topside of the blue trendline.
That kiss, and scalded cat bounce, has validated the idea that the 'blue' trendline is now a line of support. That was the best low-risk entry offered.
After that, it was off to the races and today it has pushed above the Fibonacci 62% resistance, heading for major resistance in the £17 area at the Fibonacci 78% level.
But that's not all - I have another target from a different method. The rally off the summer low is a five-wave continuation pattern. This is a pattern which looks like a five-wave zig-zag. Here it is in close-up on the daily:
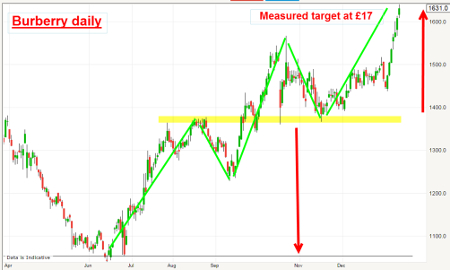
The five waves are readily seen marked in 'green'. What is striking about this pattern is that it often comes half-way along a wave.
So, with this knowledge, I have drawn in 'yellow' the mid-point of the pattern and measuring the depth to the summer low. I can draw the upper 'red' arrow to the same height - and that places my measured target also at the £17 area.
So now I have two independent targets for the current rally - at the £17 area. This would be a terrific place to take at least some profits off the table. The shares are currently trading at £16.30 so there is a little more to go.
This article is for information and discussion purposes only and does not form a recommendation to invest or otherwise. The value of an investment may fall. The investments referred to in this article may not be suitable for all investors, and if in doubt, an investor should seek advice from a qualified investment adviser.
These articles are provided for information purposes only. Occasionally, an opinion about whether to buy or sell a specific investment may be provided by third parties. The content is not intended to be a personal recommendation to buy or sell any financial instrument or product, or to adopt any investment strategy as it is not provided based on an assessment of your investing knowledge and experience, your financial situation or your investment objectives. The value of your investments, and the income derived from them, may go down as well as up. You may not get back all the money that you invest. The investments referred to in this article may not be suitable for all investors, and if in doubt, an investor should seek advice from a qualified investment adviser.
Full performance can be found on the company or index summary page on the interactive investor website. Simply click on the company's or index name highlighted in the article.
Disclosure
We use a combination of fundamental and technical analysis in forming our view as to the valuation and prospects of an investment. Where relevant we have set out those particular matters we think are important in the above article, but further detail can be found here.
Please note that our article on this investment should not be considered to be a regular publication.
Details of all recommendations issued by ii during the previous 12-month period can be found here.
ii adheres to a strict code of conduct. Contributors may hold shares or have other interests in companies included in these portfolios, which could create a conflict of interests. Contributors intending to write about any financial instruments in which they have an interest are required to disclose such interest to ii and in the article itself. ii will at all times consider whether such interest impairs the objectivity of the recommendation.
In addition, individuals involved in the production of investment articles are subject to a personal account dealing restriction, which prevents them from placing a transaction in the specified instrument(s) for a period before and for five working days after such publication. This is to avoid personal interests conflicting with the interests of the recipients of those investment articles.