Chart of the week: Is Shell about to go out of business?
6th February 2017 11:46
by John Burford from interactive investor
Share on
Is Royal Dutch Shell about to go out of business?
Have you noted the recent avalanche of articles appearing in the mainstream media that prophesies the demise of the oil industry? I certainly have - and this has my Contrarian Antennae twitching as if they have the St Vitus Dance.
Basically, it boils down to two supposed factors. One is that because the oil industry pundits got it all spectacularly wrong in the Peak Oil alarm a few decades back, they are also getting it wrong in the current bullish outlook for renewables.
Remember that the Peak Oil theory was based on a Shell oil engineer's 1950s chart that showed oil production would peak around 1970 and all of the easy oil fields had been found. Slim pickings thereafter. That, of course, would lead to major shortages - and forever high prices. Some even predicted over $200 a barrel in the 1970s.
We all know what happened thereafter. Here is chart of WTI crude since 1950:
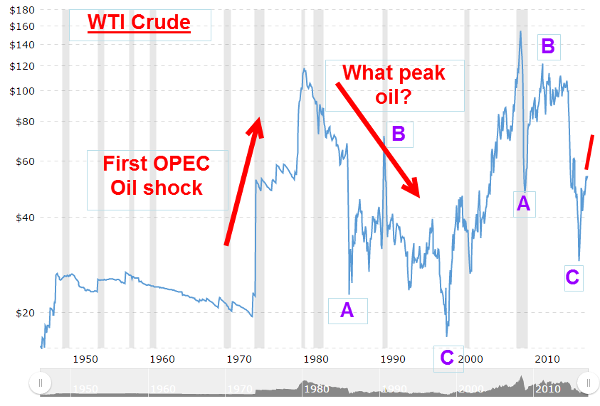
Of course, it would have needed an unusual futurist with an excellent crystal ball in the 1950s to forecast the emergence of the fracking industry, as we saw in the 2010s.
In the early 2000s, oil prices were driven higher as the Peak Oil idea was dusted off again and in a bullish scenario, prices reached the $150 level before falling hard in a cascade of selling. But admire the very wide price range - from a low of around $15 in 1997 to a $150 high in 2008 - a ten-fold range.
Fracking revolution
Although this is a semi-managed commodity, it behaves like a freely-traded one - and is, therefore, ideal for analysis using my Tramline methods. It may have the most wide-ranging price history on the board.
The decline off the $150 high has been very sharp as evidently the bulls had ignored the massive transformation in the market brought about by the fracking revolution. Current WTI prices are bang in the area of the average price of $50 since the first Oil Shock in the early 1970s.
Why do so many get oil price forecasts wrong? It is simply because they believe prices are driven by changes in supply and demand - as impossible to quantify as they are.
If supply and demand factors dictate prices, why do gold prices swing as much as they do? After all, because gold is not consumed in the same was as oil is, and the stockpile (supply) of gold is always increasing and never decreases, the potential supply to the market is always increasing. High prices bring out the sellers (and buyers) and low prices inhibit buying (and selling).
Yet there are times when gold is in a rapid bull trend that usually signifies constriction of supply in any other commodity. Yet gold supply always increases!
What stands out for me in the above chart are the two major A-B-C corrective patterns off the highs. These corrections imply prices will remain in a bullish trend for some time.
The second factor is that many believe Saudi Arabia, as the world's leading very low cost supplier, is planning the end of the Oil Age as renewables take over. Of course, many other nations are planning on the same thing as the green revolution gathers pace.
But, as far back as 2000, the Saudi oil minister said: "Thirty years from now there will be a huge amount of oil - and no buyers. Oil will be left in the ground. The Stone Age came to an end, not because we had a lack of stones, and the oil age will come to an end not because we have a lack of oil."
Anti-oil no surprise
So, the recent spate of anti-oil articles should come as no surprise. We have seen it all before.
And the renewable energy bandwagon keeps rolling. Here is a recent Telegraph article that also highlights the end of the Oil Age contained in the latest BP Energy Review. It points to the record energy reserves in the ground that "will never be extracted". In addition, renewable energy costs are widely reported to be falling dramatically, and some claim that the power generated by stations powered by heavily subsidised renewables are now on a par with those from low-cost coal.
So, with such major headwinds, oil prices and share prices of the majors should be falling, shouldn't they? Not if markets do not follow the news! As I have amply demonstrated in these articles, markets are driven by changes in sentiment and often move against the obvious direction as implied by conventional analysis.
The last time I covered was back in August. Since then, the shares have moved up sharply from my entry at around £15 to a recent £24 - a very decent gain of 60% - and investors have collected the 6.5% dividend yield based on the recent £22 price and a hefty 10% yield if bought at £15. Nice work.
Here is the weekly:
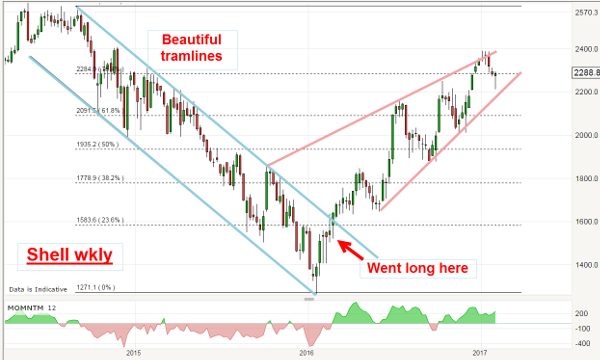
Note my beautiful tramline pair, both lines of which possess multiple accurate touch points (the mark of reliable lines of support/resistance).
With such impressible gains, are the shares now running of steam, or is there lots more?
If the share price can move above the old high at £26, that would herald a new dawn for Shell and totally confound the pundits - but watch the potentially bearish pink wedge pattern.
Read more about John and his successful Tramline Trading strategy here
This article is for information and discussion purposes only and does not form a recommendation to invest or otherwise. The value of an investment may fall. The investments referred to in this article may not be suitable for all investors, and if in doubt, an investor should seek advice from a qualified investment adviser.
These articles are provided for information purposes only. Occasionally, an opinion about whether to buy or sell a specific investment may be provided by third parties. The content is not intended to be a personal recommendation to buy or sell any financial instrument or product, or to adopt any investment strategy as it is not provided based on an assessment of your investing knowledge and experience, your financial situation or your investment objectives. The value of your investments, and the income derived from them, may go down as well as up. You may not get back all the money that you invest. The investments referred to in this article may not be suitable for all investors, and if in doubt, an investor should seek advice from a qualified investment adviser.
Full performance can be found on the company or index summary page on the interactive investor website. Simply click on the company's or index name highlighted in the article.
Disclosure
We use a combination of fundamental and technical analysis in forming our view as to the valuation and prospects of an investment. Where relevant we have set out those particular matters we think are important in the above article, but further detail can be found here.
Please note that our article on this investment should not be considered to be a regular publication.
Details of all recommendations issued by ii during the previous 12-month period can be found here.
ii adheres to a strict code of conduct. Contributors may hold shares or have other interests in companies included in these portfolios, which could create a conflict of interests. Contributors intending to write about any financial instruments in which they have an interest are required to disclose such interest to ii and in the article itself. ii will at all times consider whether such interest impairs the objectivity of the recommendation.
In addition, individuals involved in the production of investment articles are subject to a personal account dealing restriction, which prevents them from placing a transaction in the specified instrument(s) for a period before and for five working days after such publication. This is to avoid personal interests conflicting with the interests of the recipients of those investment articles.