Chartist solves riddle of FTSE 100
20th February 2017 09:38
by Alistair Strang from Trends and Targets
Share on
Written: 19 February 2017 - 23:15
The FTSE 100 update (FTSE:UKX) and BRENT too.
There have been times recently when we've been quite puzzled at just what the heck is going on with the markets. Behaviour with the FTSE, S&P, and Dow Jones will often leave us quite perplexed, even feeling slightly clueless. And then the penny dropped.
We've never been here before!
The indices are literally boldly going where they've never been and trying to apply logic, which has worked since 2009, ceased being a good idea when the markets started mapping new highs.
It's not that we're getting things wrong - the behaviour of the FTSE when it reached 7,358 proved conclusively our calculations remain correct – but, instead, we'd grown used to things happening within rough timeframes and now, this prior mental framework is no longer viable.
A case in point - while not being FTSE - is Brent crude. We'd given two target levels against this, firstly an expectation of $57 with secondary, if bettered, at $61.
Back at the start of January, Brent achieved $57.11 and has resolutely refused to close a session above this point in the period since. In fact, the product has illustrated remarkable stability, feeling similar to the period through 2014 until the collapse which was to lead to $28.
Currently, Brent would require dripping below $48 before we'd dare suggest our $61 thing is impossible, but we must concede, the basic argument of "if it ain't goin' up, it's goin' down" risks applying.
So, having laid our excuses out beforehand, what do we expect for the FTSE this week?
It's worth remembering the key number for more big picture oomph will be closure above 7,338 points, so we must look for reasons capable of triggering this honeypot.
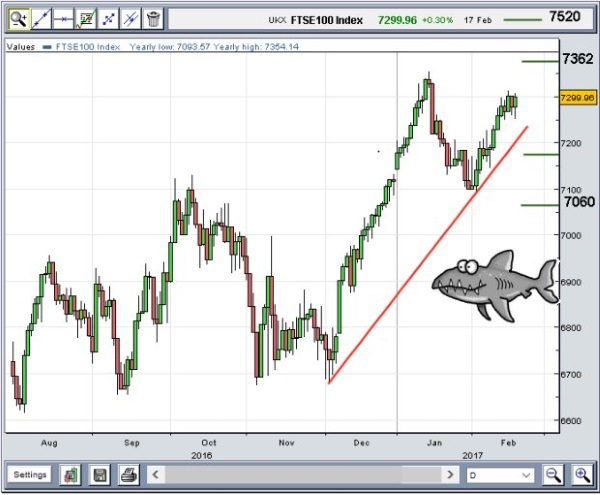
Near term, it feels like anything now above 7,308 points should start a cycle toward 7,362 points. If triggered, it needs below 7,225 to cancel the growth prospect.
Our secondary above 7,362 is at 7,520, though we'd advocate a large degree of scepticism against this, if thinking it could happen within the week.
The market is just not moving very fast.
Of course, what happens if 7,225 fails? We'll be looking for weakness toward 7,170 initially, with secondary a rather concerning 7,060 points.
As the chart shows, this takes us into the realm of low lows with the risk of some real misery for the future.
This article is for information and discussion purposes only and does not form a recommendation to invest or otherwise. The value of an investment may fall. The investments referred to in this article may not be suitable for all investors, and if in doubt, an investor should seek advice from a qualified investment adviser.
Alistair Strang has led high-profile and "top secret" software projects since the late 1970s and won the original John Logie Baird Award for inventors and innovators. After the financial crash, he wanted to know "how it worked" with a view to mimicking existing trading formulas and predicting what was coming next. His results speak for themselves as he continually refines the methodology.