Chart of the week: Great area to buy this FTSE 100 bank
24th April 2017 13:09
by John Burford from interactive investor
Share on
FTSE zooms higher post Macron win
I last covered the combination of the and last November so I thought I would repeat the formula today. First, the FTSE has lost over 300 points since making the all-time high near 7,450 on 17 March. This is the largest decline since last December and topped a very pretty Elliott wave pattern that heralded the decline - and where nimble traders should have positioned short on the signals offered (and exited their long trades at the same time).
But this morning, traders have pushed the index up over 100 points as I write in a reaction to the France election result. However, that comes after I identified a terrific short trade that I covered on Friday for a profit of over 200 points. Here is that trade.
This was the chart I prepared on 13 April when FTSE was trading around the 7,300 area and my Elliott wave labels are marked:
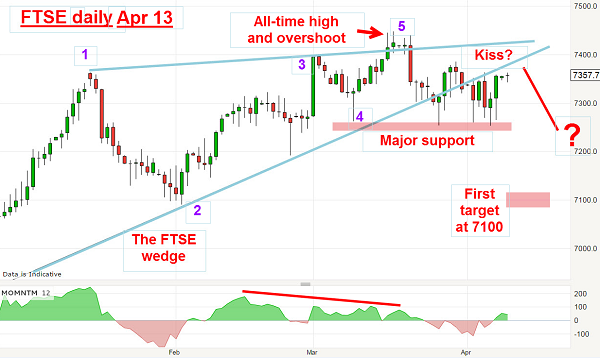
I identified a very reliable wedge (or ending diagonal) after the stunning Trump Bump rally, which had the required five waves to complete. I also noted the overshoot into the all-time high that usually foretells a massive reversal is due. And the building momentum divergence into the high was an added bonus.
On the morning of 13 April, the market was pushing up to kiss the lower wedge line and I suggested that the market will now decline in a scalded cat bounce and test the support level at the 7,250 area.
So that was the setup a fortnight ago. I had a low risk entry (stops tight), high probability trade on - to short FTSE around 7,350 with my initial target at the 7,100 area.
To complete the picture, here are my Elliott wave labels for the entire Trump Bump.
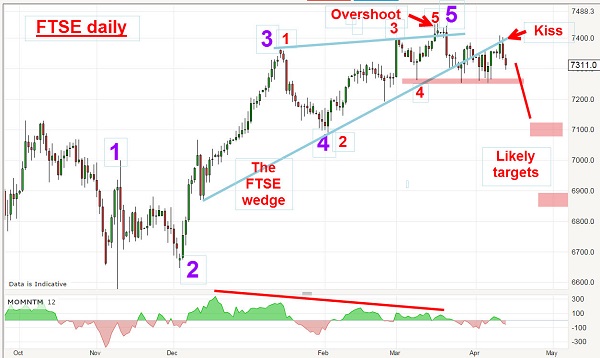
In fact, the entire rally off the June low is a complete five-up on a strong momentum divergence. Odds were high I had a winning trade on my hands - and here is the updated chart:
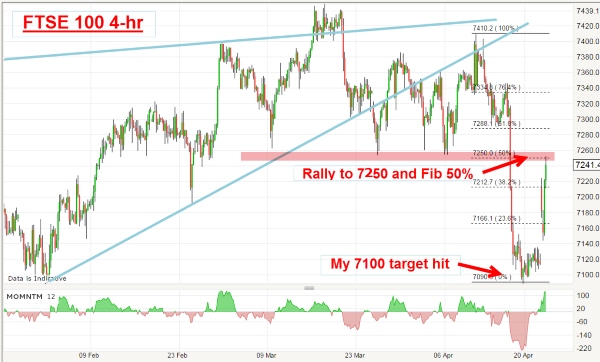
Overnight, the market has zoomed up from last week's hit on the 7,100 level, which is where I advised profit-taking on shorts, for a tidy profit of 250 pips.
Aggressive traders would take that hit as an opportunity to go long, looking for a move up to the pink resistance area at 7,250 which is also the area of the Fibonacci 50% correction. This is very powerful resistance and my feeling is that it would take a great deal of buying power to move the index strongly above it.
So is this another tradeable point?
Standard Chartered remains in a relief rally
When I covered Standard Chartered last November, the shares were already in a relief rally following the stunning bear run to the 2016 low. Here is the weekly chart:
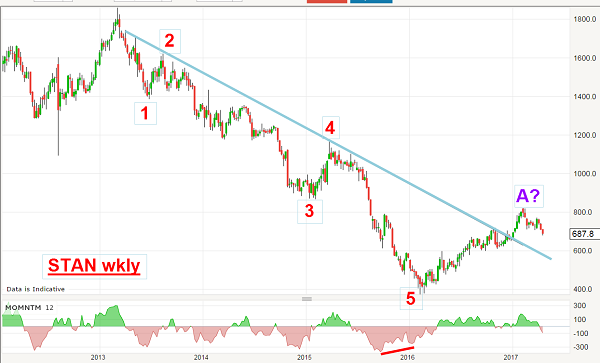
There is a clear five-wave pattern to the January 2016 low with the third wave being long and strong, as is normal. Then, the final wave five was especially brutal (for the bulls) and also has its own five-wave pattern. But the building momentum divergence gave warning that the end was high - and came with the 370p low on 17 February last year.
One basic rule Mr Elliott discovered was that charts are patterned in five waves and then three counter-trend waves. A five is followed by a three in the opposite direction.
Not to disappoint Mr Elliott, the market duly climbed off the low and eventually broke above the major blue downtrend line. This is a very significant line. Before the upward break, it acted as a reliable line of resistance. Every time the market attempted to get above it, the selling forces prevailed and a short sale then was indicated every time the market touched the line.
But now, the line is acting as support. If the market can retreat to test it, that would likely be a great area to buy.
Of course, the burning question is whether the rally can continue. But let's compare the two charts. Standard Chartered is in the banking and finance sector and its fortunes are very much tied to the state of the economy and the markets.
While the FTSE has recently made an all-time high after a multi-year bull run, STAN certainly has not - in fact, it has only started to climb the steps in the cellar into which it had fallen with a thump.
STAN made its high at the 2,000p area in November 2010 when the FTSE traded at around 5,600. While FTSE has gained 1,800 points (33%) since then, STAN has lost £13 (66%). Wow! So which one is telling the truth about the global economy? Surely, they can't both be right?
This article is for information and discussion purposes only and does not form a recommendation to invest or otherwise. The value of an investment may fall. The investments referred to in this article may not be suitable for all investors, and if in doubt, an investor should seek advice from a qualified investment adviser.
These articles are provided for information purposes only. Occasionally, an opinion about whether to buy or sell a specific investment may be provided by third parties. The content is not intended to be a personal recommendation to buy or sell any financial instrument or product, or to adopt any investment strategy as it is not provided based on an assessment of your investing knowledge and experience, your financial situation or your investment objectives. The value of your investments, and the income derived from them, may go down as well as up. You may not get back all the money that you invest. The investments referred to in this article may not be suitable for all investors, and if in doubt, an investor should seek advice from a qualified investment adviser.
Full performance can be found on the company or index summary page on the interactive investor website. Simply click on the company's or index name highlighted in the article.
Disclosure
We use a combination of fundamental and technical analysis in forming our view as to the valuation and prospects of an investment. Where relevant we have set out those particular matters we think are important in the above article, but further detail can be found here.
Please note that our article on this investment should not be considered to be a regular publication.
Details of all recommendations issued by ii during the previous 12-month period can be found here.
ii adheres to a strict code of conduct. Contributors may hold shares or have other interests in companies included in these portfolios, which could create a conflict of interests. Contributors intending to write about any financial instruments in which they have an interest are required to disclose such interest to ii and in the article itself. ii will at all times consider whether such interest impairs the objectivity of the recommendation.
In addition, individuals involved in the production of investment articles are subject to a personal account dealing restriction, which prevents them from placing a transaction in the specified instrument(s) for a period before and for five working days after such publication. This is to avoid personal interests conflicting with the interests of the recipients of those investment articles.