Chart of the week: A chart technician's dream
22nd May 2017 12:13
by John Burford from interactive investor
Share on
STAN is riding my waves
This share has been one of my favourites since I started writing COTW because it has traced out lovely textbook Elliott waves, trendlines/tramlines and Fibonacci retracements. In fact, it has been a chart technician's dream.
I last updated my coverage on 24 April and much has happened in the general market since then, with a Trump Slump in the Dow and a 'bullish' Macron Mound in France. So have these big events put a huge dent in my roadmap forecast last month?
After all, 99.999% of investors/traders believe it is the news that drives the markets, and is also a heavy influence on market sentiment that is the ultimate force behind the up and down waves we see play out in the charts.
But for yours truly and the 0.001% that understand how markets really work (hint: markets make the news, not the reverse), these events should have no real impact on forecasts that I made using my Tramline methods.
So let's put the conventional 'news makes the markets' theory to the test here. Last time, this was the chart I showed:
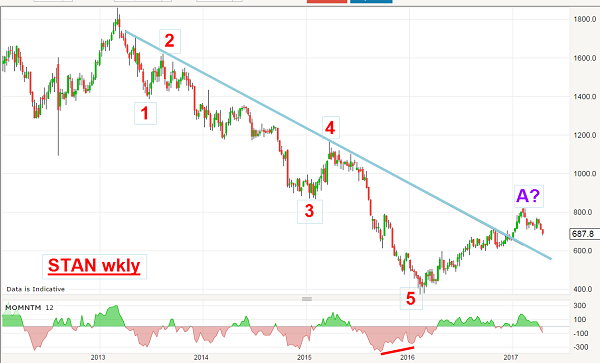
From the high in 2013, the relentless decline was in the form of a classic five Elliott waves down as marked with the lovely blue trendline using the wave 2 and wave 4 highs as touch points. Note, also the wave 5 low was made on a momentum divergence as marked by the red bar. A complete five-down is followed by a three-up -that is the firm forecast that Elliott provides.
I like to see such divergences at the ending wave 5 extreme because it confirms the selling force that drove the entire bear trend was drying up and investors/traders were far less bearish at those levels. In fact, I use this indicator to forecast reversals and these are excellent places to be a true contrarian and go long.
I read many traders who claim to be contrarians, but most are really catching a falling knife with no logical reason to trade against the trend. They are in effect saying "boy -this market has tanked, surely it can't go any lower!"
Sadly, in many cases, it sure can go lower and, without using a sensible stop loss policy, such traders take a mammoth hit -and usually throw in the towel right at the bottom just before the rally they were praying for finally emerges. This adds insult to injury because they are not on board.
No, a totally disciplined approach is especially necessary when trying to pick a top or a bottom. If you are unable to do so, then trading with an established trend is by far the safest approach.
This is what I wrote last month:
One basic rule Mr Elliott discovered was that charts are patterned in five waves and then three counter-trend waves. A five is followed by a three in the opposite direction.
Not to disappoint Mr Elliott, the market duly climbed off the low and eventually broke above the major blue downtrend line. This is a very significant line. Before the upward break, it acted as a reliable line of resistance. Every time the market attempted to get above it, the selling forces prevailed and a short sale then was indicated every time the market touched the line.
But now, the line is acting as support. If the market can retreat to test it, that would likely be a great area to buy.
And here is the chart updated:
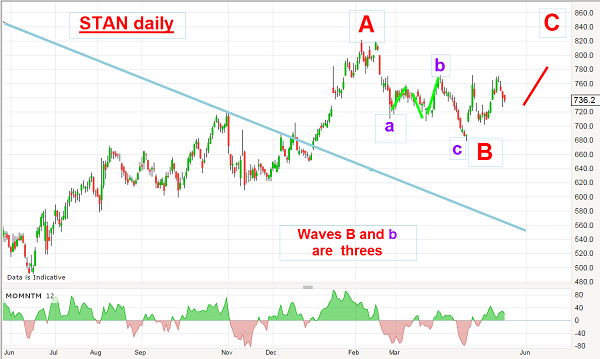
A month ago, the market was in retreat from the A wave high and, despite all of the swirling news influences, it continued to make the red B wave low and when that was in, it is rising in red wave C.
This is straight out of the Elliott Wave textbook! B waves are second waves and are usually formed by three sub-waves, as is beautifully demonstrated here. Remember, this roadmap was set back in April when the news in May was yet to be made.
If you still cling to the theory that markets are shaped by the news, ask yourself this: If you knew in advance what the news was to be tomorrow, would you be able to make a confident prediction of tomorrow's share prices?
These articles are provided for information purposes only. Occasionally, an opinion about whether to buy or sell a specific investment may be provided by third parties. The content is not intended to be a personal recommendation to buy or sell any financial instrument or product, or to adopt any investment strategy as it is not provided based on an assessment of your investing knowledge and experience, your financial situation or your investment objectives. The value of your investments, and the income derived from them, may go down as well as up. You may not get back all the money that you invest. The investments referred to in this article may not be suitable for all investors, and if in doubt, an investor should seek advice from a qualified investment adviser.
Full performance can be found on the company or index summary page on the interactive investor website. Simply click on the company's or index name highlighted in the article.
Disclosure
We use a combination of fundamental and technical analysis in forming our view as to the valuation and prospects of an investment. Where relevant we have set out those particular matters we think are important in the above article, but further detail can be found here.
Please note that our article on this investment should not be considered to be a regular publication.
Details of all recommendations issued by ii during the previous 12-month period can be found here.
ii adheres to a strict code of conduct. Contributors may hold shares or have other interests in companies included in these portfolios, which could create a conflict of interests. Contributors intending to write about any financial instruments in which they have an interest are required to disclose such interest to ii and in the article itself. ii will at all times consider whether such interest impairs the objectivity of the recommendation.
In addition, individuals involved in the production of investment articles are subject to a personal account dealing restriction, which prevents them from placing a transaction in the specified instrument(s) for a period before and for five working days after such publication. This is to avoid personal interests conflicting with the interests of the recipients of those investment articles.