Chart of the week: Barclays still in major downtrend
12th June 2017 11:18
by John Burford from interactive investor
Share on
Last week I covered and today it is the turn of , which I last analysed on November 28 last year when it was in a classic relief rally. This followed the massive 50% slide off the July 2014 high at 240p to the plunge low at around 120p in June last year on the 'surprise' Brexit vote.
Since then, the chart is showing excellent Elliott wave patterns as well as superb tramline sets, which I will show because these are essential guides for me to set accurate price targets.
For those wishing to use tramlines in their trading, this example should be of considerable help.
To recall, this was the chart back in November:
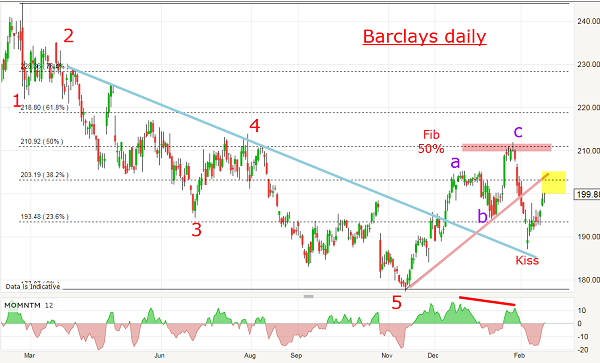
The wave 5 low last June at 120p was the final wash-out selling exhaustion phase and was the prelude to the relief rally in a small-scale A-B-C. Remember, after a five motive wave move down, I expect to see a three wave affair before the main downtrend resumes.
For trading strategy, you may play this in several ways. Because the original decline was so large (50%), I expected the recovery to be at least a significant proportion of that span - and a 62% retrace would be normal. That sets a rally target in the 225p area at the least. You could, therefore, go long anywhere in the July-November period with the 225p target in mind for a likely exit.
Or, if a longer-term player, you could have taken profits on shorts near the wave 5 low and waited for the market to rally to the 225p area, then look to short again as you would be aligning with the major trend. This is classic major-trend following discipline.
Back in November, the market was already approaching that target and this is what I wrote:
"With this evidence, odds are building that the counter-trend rally high is here or nearby. This morning, the lower wedge line has been breached, which is usually the first signal that the trend has changed.
"If this is correct, my immediate targets are the gaps on the way up in the 205p and then the 195p levels.
"What could spoil this picture? Certainly I would put it on hold if the market rallied into new highs above the 220p level. Failing that, there is a low-risk play here if you enter protective buy stops there."
So did the market rally into new highs above the 220p level, which was my warning alert? Here is the updated daily chart.
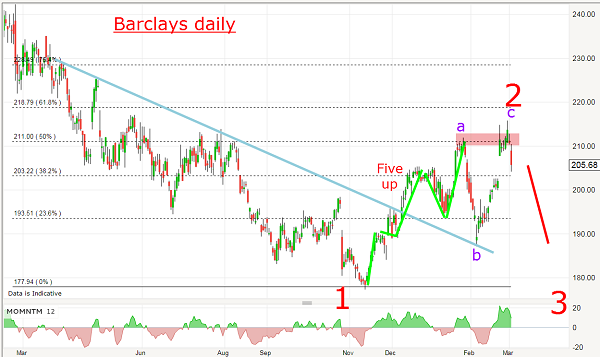
Yes, from the 213p level in November, the rally continued to the 240p level in December, and then entered a lengthy consolidation period between 240 and 220. But in that period, the market was finishing off the five waves in purple wave C!
By March I had enough on the chart to draw in a lovely tramline pair and, when the market broke down beneath it in early April on a decent momentum divergence, that was not only a flash alert to short, but I could also set T3 in place.
This supportive tramline is drawn parallel and equidistant and becomes a price target (which was almost touched on Friday). Remember my targets set back in November? One of them was the 205p area - also hit on Friday. Bingo!
But that's not all - I have another tramline trio working:
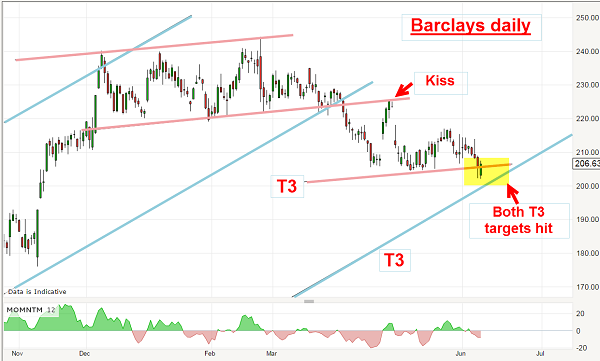
In December, as the market was breaking below the blue tramline, I could also draw a very respectable pink tramline pair that connects the lows and also the two highs.
All trading in that period was contained in the trading channel between those pink tramlines which were significant lines of resistance (upper) and support (lower).
Note that the lower blue and pink tramlines crossed over at precisely the time when the market was breaking down - a sure-fire signal the market wants to move lower. This tramline cross setup is about as close to a sure-thing as you can get in the markets.
And when the market rallied to try to kiss the blue tramline, all it could manage was a kiss on the pink tramline before peeling away very hard down in a scalded cat bounce. That was pure Tramline Trading textbook.
At the current 205p level, we have reached both T3 targets and my November target. Not bad for drawing a few lines on the chart, is it? No need to follow the company news, analyse the reports, read all the gurus and follow the politics. Everything is in the price and as I have repeatedly shown, markets have memories. That is why tramlines work!
This article is for information and discussion purposes only and does not form a recommendation to invest or otherwise. The value of an investment may fall. The investments referred to in this article may not be suitable for all investors, and if in doubt, an investor should seek advice from a qualified investment adviser.
These articles are provided for information purposes only. Occasionally, an opinion about whether to buy or sell a specific investment may be provided by third parties. The content is not intended to be a personal recommendation to buy or sell any financial instrument or product, or to adopt any investment strategy as it is not provided based on an assessment of your investing knowledge and experience, your financial situation or your investment objectives. The value of your investments, and the income derived from them, may go down as well as up. You may not get back all the money that you invest. The investments referred to in this article may not be suitable for all investors, and if in doubt, an investor should seek advice from a qualified investment adviser.
Full performance can be found on the company or index summary page on the interactive investor website. Simply click on the company's or index name highlighted in the article.
Disclosure
We use a combination of fundamental and technical analysis in forming our view as to the valuation and prospects of an investment. Where relevant we have set out those particular matters we think are important in the above article, but further detail can be found here.
Please note that our article on this investment should not be considered to be a regular publication.
Details of all recommendations issued by ii during the previous 12-month period can be found here.
ii adheres to a strict code of conduct. Contributors may hold shares or have other interests in companies included in these portfolios, which could create a conflict of interests. Contributors intending to write about any financial instruments in which they have an interest are required to disclose such interest to ii and in the article itself. ii will at all times consider whether such interest impairs the objectivity of the recommendation.
In addition, individuals involved in the production of investment articles are subject to a personal account dealing restriction, which prevents them from placing a transaction in the specified instrument(s) for a period before and for five working days after such publication. This is to avoid personal interests conflicting with the interests of the recipients of those investment articles.