Chart of the week: Tools for trading Google shares
3rd July 2017 12:08
by John Burford from interactive investor
Share on
Is Alphabet now in the soup?
Is there anyone on the face of the planet that has not heard of ? I would guess that more people living today have used the eponymous search engine than have heard of (except in China, of course)! But maybe it would be a close-run thing.
For the past several years, Google has been a cash-generating machine and has come to dominate its sector, along with the other members of the notorious FAANG Gang - , , and . Their respective competitors are very much also-rans. Investors in FAANG shares have been on a one-way trip - up.
But now they are attracting the attention of regulators in the EU, especially with well-publicised attacks on Google reported last week. But was the record $2 billion EU fine a coincidence that it occurred when the share had recently rocketed to the 'magic' $1,000 mark and is now backing off, with the current market price at $930 for a 7% decline?
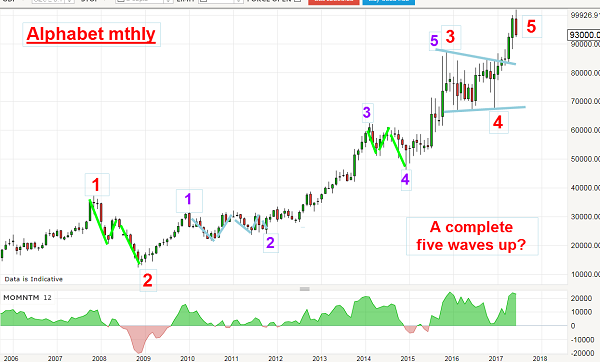
To my mind, this was no accident - and the chart shows why. Here is the very long term monthly that shows textbook Elliott wave patterns.

From its humble origins pre-2006 around the $100 area, the share started its historic bull run by rising to the $350 area just ahead of the 2008-2009 crash. And during that little bear market, they retreated back to near the $100 level in a standard A-B-C pattern (green bars).
From there, they rallied along with the main market and traced out a superb third wave to the $870 level in November 2015. This red third wave contains its own five impulsive waves (in purple). Note that both third waves are long and strong, as is normal.
Then wave 4 traced out a complex wedge that ended in December last year, before the shares rocketed up in wave 5 to the recent $1,000 level, making the investment in 2005 a ten-bagger. Nice.
Note that in the red wave pattern, we have the Guideline of Alternation* fully demonstrated. Wave 2 is a simple A-B-C three down while wave 4 is a complex five-wave wedge.
And we have the same in the purple wave pattern - wave 2 is a complex five-wave wedge and wave 4 is a simple A-B-C three down. Within the same impulse pattern, waves 2 and 4 alternated in character from simple to complex (and vice versa).
So far, so textbook. But has the entire wave pattern completed, or is there more upside in red wave 5?
In terms of sentiment, it has turned rapidly bearish with headlines such as these recent examples:
"It's all over for the FAANG stocks" - Marketwatch
"FAANG stocks are no bargain - here's why" - Forbes
"FAANG stocks once hot, now not..." - CBS News
Although a few advise buying the dip in kneejerk fashion since that technique has been generally effective for several years.
So is the $1,000 level the absolute ceiling and are the shares starting a new bear market? Let's zoom in on a tighter scale chart.

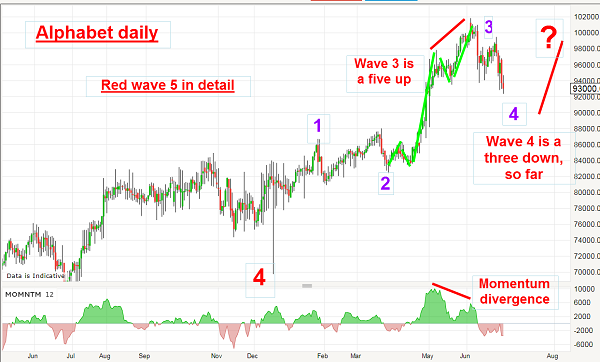
This is red wave 5 from the wave 4 low and shows purple waves 1,2 and 3 in place. Note that Wave 3 topped at the $1,000 level on a large momentum divergence that signalled a hefty decline into wave 4.
But now wave 4 is in progress and has a three-down look so far. Remember, three-down patterns are always corrective to the main trend, which is up. That means with this information, I am unable to give a high-confidence outlook. I need to see more chart action before passing judgment.
If the wave 4 really is a three-down (which would fit the Guideline of Alternation, since purple wave 2 is a complex pattern), that suggests when wave 4 turns, we shall see new highs above $1,000 in the final purple wave 5.
But if the market moves quickly lower, we could be in a third wave down suggesting much lower targets.
Whichever occurs near-term, we are very near the highs for the bull market.
*According to the Guideline of Alternation, if wave two of an impulse is a sharp retracement, wave four will likely be a sideways correction, and vice versa.
These articles are provided for information purposes only. Occasionally, an opinion about whether to buy or sell a specific investment may be provided by third parties. The content is not intended to be a personal recommendation to buy or sell any financial instrument or product, or to adopt any investment strategy as it is not provided based on an assessment of your investing knowledge and experience, your financial situation or your investment objectives. The value of your investments, and the income derived from them, may go down as well as up. You may not get back all the money that you invest. The investments referred to in this article may not be suitable for all investors, and if in doubt, an investor should seek advice from a qualified investment adviser.
Full performance can be found on the company or index summary page on the interactive investor website. Simply click on the company's or index name highlighted in the article.
Disclosure
We use a combination of fundamental and technical analysis in forming our view as to the valuation and prospects of an investment. Where relevant we have set out those particular matters we think are important in the above article, but further detail can be found here.
Please note that our article on this investment should not be considered to be a regular publication.
Details of all recommendations issued by ii during the previous 12-month period can be found here.
ii adheres to a strict code of conduct. Contributors may hold shares or have other interests in companies included in these portfolios, which could create a conflict of interests. Contributors intending to write about any financial instruments in which they have an interest are required to disclose such interest to ii and in the article itself. ii will at all times consider whether such interest impairs the objectivity of the recommendation.
In addition, individuals involved in the production of investment articles are subject to a personal account dealing restriction, which prevents them from placing a transaction in the specified instrument(s) for a period before and for five working days after such publication. This is to avoid personal interests conflicting with the interests of the recipients of those investment articles.