Chart of the week: Targeting 20% upside for this share
17th July 2017 12:09
Has Anglo American finally turned?
Sentiment has turned bearish against the big miners in recent months. With South Africa announcing big changes in share ownership rules, shares in moved lower. But have they completed a normal bull market correction and ready to power higher? Let's look at the evidence.
Recall last year I turned bullish on the grossly oversold miners very near the lows, but underestimated how high the relief rally could stretch and took some profits way too early. Luckily, I held onto part of my position using a 'just in case' rationale.
So, has the five-month correction run its course - and, importantly, can I top up my holdings?
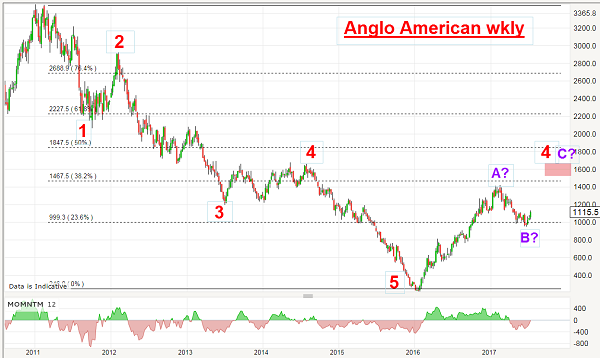
For perspective, let's go back to the weekly chart. Here it is showing the savage bear trend off the 2011 highs. And that trend is in a clear five-wave impulsive pattern that conforms beautifully to Mr Elliott's Rules and Guidelines.

Although wave 3 is not longer than wave 5, it is 'long and strong'. Last week, I showed the chart of which displayed a lovely example of the Guideline of Alternation, whereby waves 2 and 4 are often of opposing characters. Here, too, this Guideline is on full display with wave 2 being a simple A-B-C affair and wave 4 a complex wedge/triangle.
Also, wave 5 is a lengthy wave which is typical of commodity charts - and commodity-based share charts. When dealing with these markets, I am always on the lookout for extended fifth waves when appropriate. My reason? Simply because it is far too easy to call a turn prematurely - and catch a falling knife instead!
In fact, the plunge in late 2015 was a great time to get your fingers badly cut. With the shares trading around the £10 area in April, who could have imagined they would fall to the £2.20 level just a few months later - a collapse of almost 80%?
What investor would not have been at least a little miffed with this loss? And if they had bought shares much above the £10 level, the loss would have been that much greater. Ouch!
Personally, if I were in this position, I would have jumped ship early (that's what stop losses were invented for) and either sat on cash or looked for better opportunities elsewhere.
I never marry a position - it can be fatal not only to your wealth but your sanity. Traders are more into one-night-stands than devoted to life-long unions.
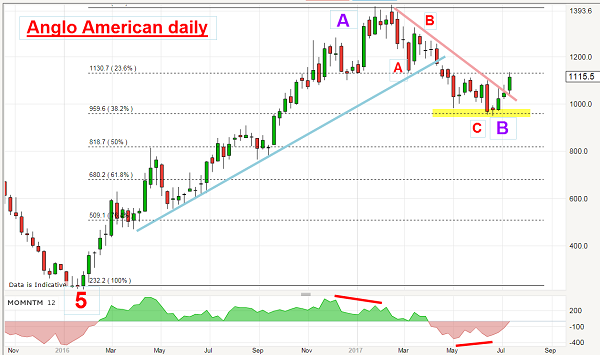
The rally off the low has been pretty much straight up - here is the daily chart.

That has created a fairly rare "V" low - and these are among the trickiest to trade from a technical angle. But with the high made in February, the market has traced out a pretty A-B-C correction right to the Fibonacci 38% level. Note that this has created a momentum divergence - and that heralds a possible reversal since it implies the selling power is drying up.
And on Friday, the market edged well above the short-term pink trendline in a bullish show of strength.
All of these factors are conducive to a bullish stance here with a target at the old highs in the £14 area with higher potential thereafter.
These articles are provided for information purposes only. Occasionally, an opinion about whether to buy or sell a specific investment may be provided by third parties. The content is not intended to be a personal recommendation to buy or sell any financial instrument or product, or to adopt any investment strategy as it is not provided based on an assessment of your investing knowledge and experience, your financial situation or your investment objectives. The value of your investments, and the income derived from them, may go down as well as up. You may not get back all the money that you invest. The investments referred to in this article may not be suitable for all investors, and if in doubt, an investor should seek advice from a qualified investment adviser.
Full performance can be found on the company or index summary page on the interactive investor website. Simply click on the company's or index name highlighted in the article.
Disclosure
We use a combination of fundamental and technical analysis in forming our view as to the valuation and prospects of an investment. Where relevant we have set out those particular matters we think are important in the above article, but further detail can be found here.
Please note that our article on this investment should not be considered to be a regular publication.
Details of all recommendations issued by ii during the previous 12-month period can be found here.
ii adheres to a strict code of conduct. Contributors may hold shares or have other interests in companies included in these portfolios, which could create a conflict of interests. Contributors intending to write about any financial instruments in which they have an interest are required to disclose such interest to ii and in the article itself. ii will at all times consider whether such interest impairs the objectivity of the recommendation.
In addition, individuals involved in the production of investment articles are subject to a personal account dealing restriction, which prevents them from placing a transaction in the specified instrument(s) for a period before and for five working days after such publication. This is to avoid personal interests conflicting with the interests of the recipients of those investment articles.
Editor's Picks