Chart of the Week: An "excellent trade" for BT
31st July 2017 11:07
It is always a great idea for traders and investors to keep referring to their long-term monthly and weekly charts for perspective on the current setup.
Most of us focus on the short-term action - and that is very important, of course. You need to know if your trade is on the right track or not and the daily chart (and the finer scales) can keep you honest.
But it is the long-term picture that can indicate important support or resistance areas the other charts are unable to illustrate - and these areas can be set years ago. That is because markets have memories - sometimes very long ones.
Today, I want to show how a 10-year-old chart support area in the monthly chart has now come into play - and has pinpointed an excellent trade.
I last covered this share on 15 May and this was the monthly chart I showed then:
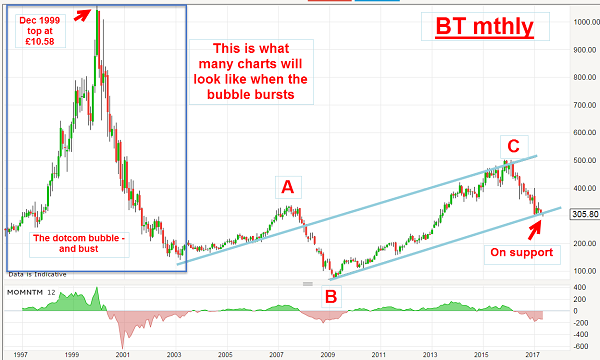
I pointed out the tech mania of the 1990s resulted in BT rocketing to over £10 on the basis that BT actually had a website. Back then, income-generating websites were more valuable than gold - and even rarer.
Of course, with only dial-up connections through a modem available, e-commerce was in its infancy and it's remarkable to me that we have come so far in less than 20 years.
So, for almost 15 years, poor old BT has been struggling to recover from the tech bust and has traced out an A-B-C three-wave pattern, which is the normal form.
Last May, I ventured to suggest that, with the share price around the £3 level, and with tramline support close by, a 'buy' rating was indicated.
But what I failed to do in May was to point out that, at the £3 area, the shares were entering a region of chart support from 10 years previously. Here is the chart support shown:
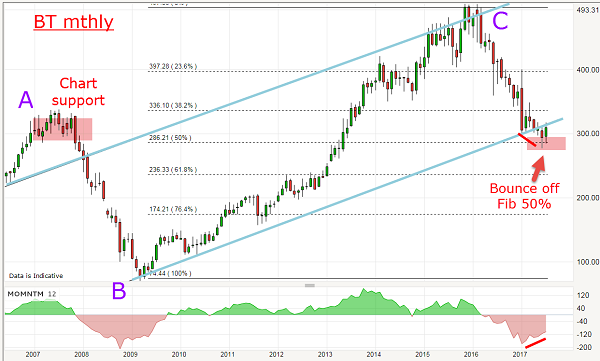
This was the wave A high region, of course. Not only that, but the £3 area also lies on the area of the Fibonacci 50% retrace of wave C - a common line of support/resistance. This makes the £3 area a region of doubly strong support and backs up my bullish case.
Here is the updated action on the daily:
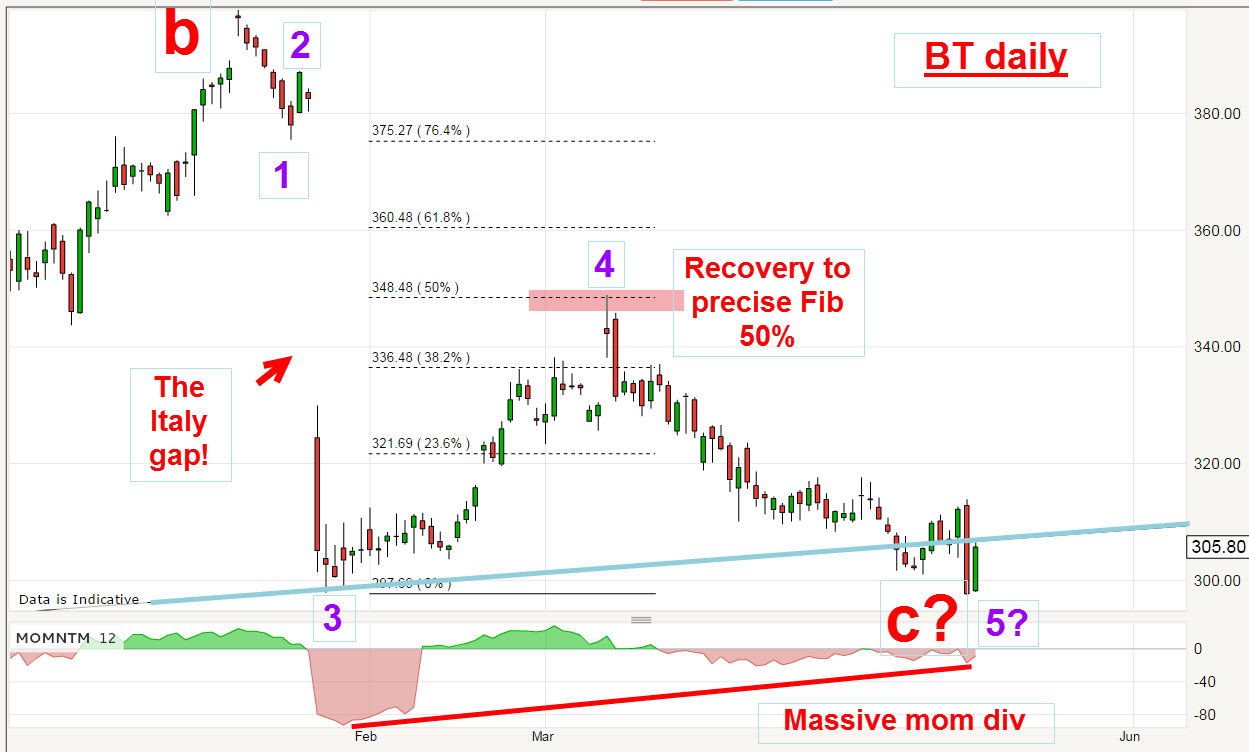
Following my last column in May, the market did decline a little further into the 280p area, but found the strong support described above. And in July the market has been rallying back to the blue tramline and is about to push above it again in a third wave.
Provided the 320p area can be penetrated, the next test will come at the 350p area and if that can be overcome, it would set up the likelihood the huge January gap can be filled to the 380p area.
Remember, most large gaps do eventually get filled and this would be an ideal opportunity, especially with the current negative sentiment surrounding the company following the latest weak earnings report. But when has weak earnings stopped a bull run?
These articles are provided for information purposes only. Occasionally, an opinion about whether to buy or sell a specific investment may be provided by third parties. The content is not intended to be a personal recommendation to buy or sell any financial instrument or product, or to adopt any investment strategy as it is not provided based on an assessment of your investing knowledge and experience, your financial situation or your investment objectives. The value of your investments, and the income derived from them, may go down as well as up. You may not get back all the money that you invest. The investments referred to in this article may not be suitable for all investors, and if in doubt, an investor should seek advice from a qualified investment adviser.
Full performance can be found on the company or index summary page on the interactive investor website. Simply click on the company's or index name highlighted in the article.
Disclosure
We use a combination of fundamental and technical analysis in forming our view as to the valuation and prospects of an investment. Where relevant we have set out those particular matters we think are important in the above article, but further detail can be found here.
Please note that our article on this investment should not be considered to be a regular publication.
Details of all recommendations issued by ii during the previous 12-month period can be found here.
ii adheres to a strict code of conduct. Contributors may hold shares or have other interests in companies included in these portfolios, which could create a conflict of interests. Contributors intending to write about any financial instruments in which they have an interest are required to disclose such interest to ii and in the article itself. ii will at all times consider whether such interest impairs the objectivity of the recommendation.
In addition, individuals involved in the production of investment articles are subject to a personal account dealing restriction, which prevents them from placing a transaction in the specified instrument(s) for a period before and for five working days after such publication. This is to avoid personal interests conflicting with the interests of the recipients of those investment articles.
Editor's Picks