Chart of the week: Buy, sell, or hold Prudential?
7th August 2017 11:18
by John Burford from interactive investor
Share on
Is it prudent to take some profits in Prudential here?
Since at least July of last year, I have maintained a bullish stance on . No, my conclusion had nothing to do with the operating earnings outlook, or the increases in investment returns from its portfolio of stocks and bonds, or the decent dividend yield, or the vigorous thrust into the rapidly-growing middle class market of Asia. I could go on.
In fact, I only skim this kind of data to get a general picture of the background information that most other investors pour over. And when investors become positively bullish on a share, that is when a disappointment of one kind or another will likely send many investors scurrying for cover - and the share price sinks.
That is when you can easily give up some or most of your hard-won gains - and send you into a very emotional state. Do you abandon ship here, or do you buy more, or do you just sell some of your holdings? Or do you just do nothing and hope for the best? Making this kind of decision while your feelings are running high is rarely wise.
I would say most small investors opt for the latter option and there are plenty of mainstream media pundits out there that agree - the most common advice in such circumstances is "Batten down the hatches".
But hoping for the best is not a sensible investment method. I maintain every investor/trader must have a rock-solid money management strategy in order to stay ahead of the crowd - and to be prepared whatever the markets throw at you.
So, let's turn to Prudential and see where we are in its superb bull run.
Last July, I was bullish when the shares were trading at the £12 level and when I covered it again on 20 March, the market had risen to £18 level, which was a major target of mine.
I suggested taking some profits there and to await a dip where I expected a resumption of the bull trend.
This was the chart I showed in March:
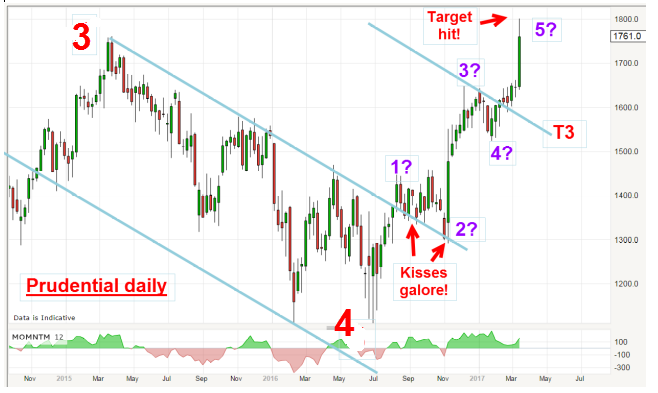
The decline is a classic correction (large overlapping waves) and I have a solid set of tramlines. One target at T3 was already hit at the £16.50 level in December. But the uptrend was intact and my next target was the £18 level which was hit on the last candle on the chart in March.
But the most prominent feature to me is the five purple waves that are near the end of its travel. The market was in the final fifth wave off the £12 low. And, according to Elliott wave theory, when that fifth wave ends, the market will retreat and the decline will likely be sharp.
So, I was on the lookout for a top where to take profits.
And here is the updated chart
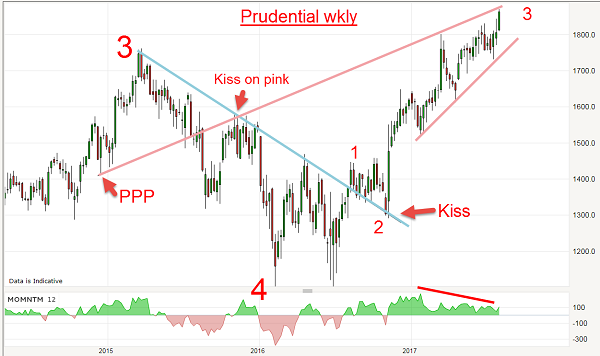
To review the Elliott waves: Wave 3 is a multi-year classic 'long and strong' third wave. And from the £12 wave 4 low, I have a rally in small wave 1 which broke above the blue trendline, and a pull-back to kiss the trendline in wave 2 (again, a typical feature of a reversal).
After the kiss, there was a normal scalded cat bounce up away from the trendline that sent the shares to the first £18 target. But since March, the shares have only gained 50p net to the £18.50 level. That's not very impressive for a bull run, is it?
Now take a look at my upper pink trendline. On the left, I have a Prior Pivot Point (PPP) which acts as an anchor for the upper line of support/resistance. And after the 2016 kiss, this line has acted as strong resistance.
In recent weeks, with the shares shooting up, it has made several attempts to break through this line, but has failed every time. This implies the resistance at this line remains very strong. And there is a large momentum divergence as the market rises - a sure warning sign that buying power is waning.
There are many bulls who have a £20 target, but history is filled with targets that fail when they are widely believed.
So, with the shares at the upper line of resistance and a momentum divergence, I believe it prudent to take major profits here from the £12 level - for a gain of over 50%.
If my labels are correct, we are at or near the end of wave 3 and the next big move will be a decline in wave 4.
These articles are provided for information purposes only. Occasionally, an opinion about whether to buy or sell a specific investment may be provided by third parties. The content is not intended to be a personal recommendation to buy or sell any financial instrument or product, or to adopt any investment strategy as it is not provided based on an assessment of your investing knowledge and experience, your financial situation or your investment objectives. The value of your investments, and the income derived from them, may go down as well as up. You may not get back all the money that you invest. The investments referred to in this article may not be suitable for all investors, and if in doubt, an investor should seek advice from a qualified investment adviser.
Full performance can be found on the company or index summary page on the interactive investor website. Simply click on the company's or index name highlighted in the article.
Disclosure
We use a combination of fundamental and technical analysis in forming our view as to the valuation and prospects of an investment. Where relevant we have set out those particular matters we think are important in the above article, but further detail can be found here.
Please note that our article on this investment should not be considered to be a regular publication.
Details of all recommendations issued by ii during the previous 12-month period can be found here.
ii adheres to a strict code of conduct. Contributors may hold shares or have other interests in companies included in these portfolios, which could create a conflict of interests. Contributors intending to write about any financial instruments in which they have an interest are required to disclose such interest to ii and in the article itself. ii will at all times consider whether such interest impairs the objectivity of the recommendation.
In addition, individuals involved in the production of investment articles are subject to a personal account dealing restriction, which prevents them from placing a transaction in the specified instrument(s) for a period before and for five working days after such publication. This is to avoid personal interests conflicting with the interests of the recipients of those investment articles.