Data watch: Inflation and wages
16th October 2017 11:06
by Emil Ahmad from interactive investor
Share on
The week that was…
US
The Jolts Job Openings report last Wednesday showed jobs openings fell in the US in August to 6.082 million, missing Bloomberg's forecast of 6.125 million new positions. The July read was 6.14 million. Healthcare and durable goods manufacturing led gains, with services, education and nondurable goods manufacturing suffering most.
Thursday saw month-on-month changes in input prices. The US Producer Price Index (PPI) for final demand recorded its biggest increase in two years, driven by Hurricane Harvey. Production problems at Texas oil refineries ensured a 0.4% increase in September, double the August number.
As a tightening oil market gains momentum, the EIA Crude Oil Inventories report was a key Thursday release. Measuring weekly changes in inventory levels held by US firms, it fell by 2.8 billion barrels from the prior week. A continuing decline in inventory levels could help support oil price optimism and market stability.
On Friday, market focus was directed towards the Consumer Price Index (CPI) MoM (month-on-month) and US Core Retail Sales MoM figures. The CPI rose by 0.5% in September, an eight-month high, as hurricane disruptions and gasoline prices provided tailwinds. Similarly, core retail sales for September exceeded forecasts by 0.7%, with hurricane-related spikes in building and car sales.
UK
Relatively quiet week from a UK perspective with Manufacturing Production MoM the main headliner on Tuesday. Exceeding analysts' expectations by 0.2%, production rose 0.4% on a monthly basis in August. That nudged sterling above $1.32 resistance.
Tuesday was the big day when BRC Retail Sales Monitor YoY (year-on-year) piqued the market's interest. Analysis of changes in the value of retail sales from participating UK retail stores is a good indicator of UK consumption and economic activity. This September, retail sales grew by 1.9% versus a year ago, supportive for retail essentials although big ticket items remain a concern.
Two key releases for the week beginning 16th October
UK
Tuesday 17th October: Consumer Price Index YoY
In the UK, the CPI is the primary measure of inflation. In simplistic terms, the CPI is a basket of approximately 700 goods and services bought by households. The total cost of the basket, which is reviewed annually, reflects changes in prices of the various goods and services over time. Ultimately, the evolving cost of this basket is one of the best measures of inflationary or deflationary pressures.
UK CPI five-year chart
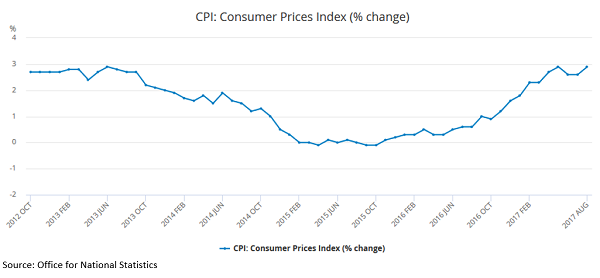
As UK inflation remains on the verge of 3%, September's forecast of 2.8% puts pressure on the Bank of England to begin a tightening credit cycle. August's reading of 2.9% was also reached in May, a four-year high.
Hawkish sentiment has been growing of late with Governor Mark Carney potentially laying the foundations for a hiking phase. Ultimately, any move away from looser monetary policy will need to be carefully balanced against the inevitable unwinding of Quantitative Easing (QE).
Raising interest rates may provide some respite for savers in their ongoing 'search for yield'. However, it will hit the most vulnerable households hardest who are becoming increasingly reliant on credit.
• The CPI also plays a vital role in upgrading pensions, wages and benefits. From a business perspective, it is often used to determine appropriate price rises for goods and services.
• It is arguably one of the most important economic indicators because in essence, it leaves little room for interpretation; the CPI is a clear, unambiguous figure based on a set of consistent criteria. Other indicators, many of which derive their value from interpreting the implications of inflation, have a more predictive quality.
• When the CPI report is released, it answers a number of market questions which can move both equities and fixed income markets.
• As inflation typically reduces the purchasing power of money within an economy, central bank policy is frequently based on controlling inflation within tolerable levels.
• It provides an essential barometer for analysts in assessing the outcome of the next MPC meeting and future interest rate policy.
Wednesday 18th October: Average Earnings Index + Bonus
The Average Earnings Index reflects movements in the price paid for labour by companies and the government. As a key short-term indicator of wage changes, it assesses this rate of change over the prior three months on a year-on-year basis and incorporates bonus payments.
In addition to signalling personal income growth, it provides information about any inflationary headwinds. It also has significant implications for personal consumption and by extension, economic activity. As with most indicators, a stronger than anticipated read should support a strengthening pound whereas a weaker reading is typically bearish from a currency perspective.
With the cost of living squeeze at the forefront of most people's minds, the relationship between wages and inflation is a key one.
In the three months to July, average earnings increased by 2.1%, slightly lower than the forecast of 2.3%. While this might have been negative for sterling, the wage rise would initially be received positively by most workers.
UK wage growth five-year chart
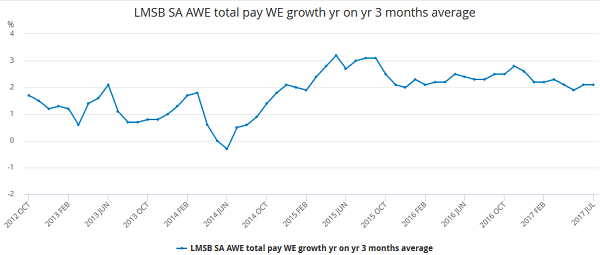
However, with inflation approaching 3%, they are actually worse off. When inflation exceeds wage growth, the worker actually experiences a fall in real income. It is only when the converse applies that workers are better off in real terms and a 'genuine' wage increase occurs.
In the current scenario, workers' purchasing power decreases and their salary buys fewer goods and services on a comparative basis. With household consumption at around 66% of UK GDP, a decrease in purchasing power cannot be a positive thing for an economy ever more reliant on debt.
Unemployment rates are at their lowest level since 1975 (4.4%). Economic theory tells us that as unemployment falls, the competition for available workers grows. This should ensure a corresponding rise in wages, a relationship explained by the Phillips Curve.
Despite unemployment at 42-year lows, wage growth is anaemic. The inverse relationship between wages and unemployment is not following an orthodox pattern. A number of theories have aired to explain this anomaly, including cheap EU labour depressing wage growth, higher labour costs (living wage, auto-enrolment) and the decline of unions protecting workers' interests.
This article is for information and discussion purposes only and does not form a recommendation to invest or otherwise. The value of an investment may fall. The investments referred to in this article may not be suitable for all investors, and if in doubt, an investor should seek advice from a qualified investment adviser.