Chart of the week: A second bite of the cherry
16th October 2017 11:32
by John Burford from interactive investor
Share on
Randgold back in rally phase
This share has been one of my star trading vehicles and I last covered it on 10 July when the gold price was falling into major support, as were shares. In that article, I outlined how to use my Break Even Rule to make a profit even when the price runs up and then back down to your entry.
Of course, this is a true technique for traders, not one used by buy-and-hold investors. But it does require more attention to the market. Sad to say, making money in the markets does require some work.
The lazy buy-and-hold approach requires no effort but can only work for a few rare issues which are in perpetual bull trends. And you have to know when to finally exit - a skill not given to many.
This was the chart I showed in July:
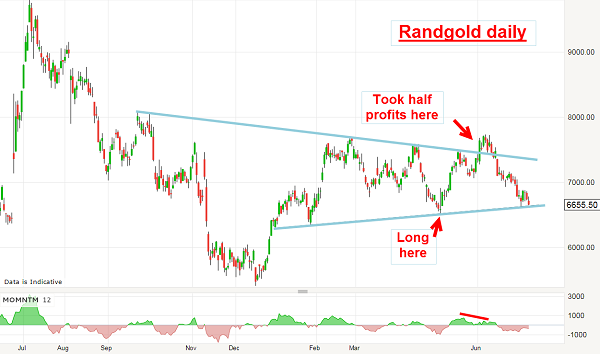
At the 6,655p level, the shares were testing the major support trendline and a sensible play was to go long there using the May low at 6,500p as guide for your stop loss.
With only a small risk to the stop, this was a very reasonable trade since the main trend remained up. So how did this trade work out? Here is the updated chart:
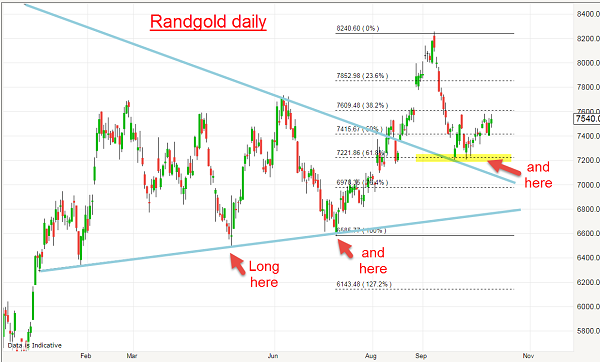
As it happened, that date 10 July saw the low of the move for both gold and Randgold. I honestly did not fix that! The support did hold and from there, gold and the shares started a vigorous bull run with the shares hitting the 8,200p level last month for a pretty decent gain of 1,600p from the July entry.
And with the shares over-stretched, it was prudent to take at least some profits off the table.
Since retracements of a Fibonacci 50% or 62% are the most common, I set these levels as likely downside targets. But as the extension of the upper trendline resistance cut through the 62% level at around 7,200p, I believed that target was the most likely.
And if it were to be attained, the market would likely place a kiss on the trendline. After a kiss usually comes a scalded cat bounce with the market shooting rapidly up away from the support. Seeing that kiss develop a little after 10 July, you could have forecast a vigorous rally, as I did.
In fact, that roadmap was highly accurate and new long trades could have been entered there at the 7,200p level.
Now the shares are trading up at the 7,500p area and appear headed higher. Of course, taking new long trades here incurs a much larger risk to a sensible stop (say, under the 7,200p level).
So, it is much better to enter at either a major line of support or at a major Fibonacci retrace - and that is why paying attention to the market at least on a daily basis can really pay off in reducing your risk.
Once you have your high and low pivots, you can set your Fibonacci levels and they give you the 50% and 62% targets and use these for setting limit orders on your platform.
That way, you are ready and do not need to be constantly monitoring the market - a great method for busy traders!
These articles are provided for information purposes only. Occasionally, an opinion about whether to buy or sell a specific investment may be provided by third parties. The content is not intended to be a personal recommendation to buy or sell any financial instrument or product, or to adopt any investment strategy as it is not provided based on an assessment of your investing knowledge and experience, your financial situation or your investment objectives. The value of your investments, and the income derived from them, may go down as well as up. You may not get back all the money that you invest. The investments referred to in this article may not be suitable for all investors, and if in doubt, an investor should seek advice from a qualified investment adviser.
Full performance can be found on the company or index summary page on the interactive investor website. Simply click on the company's or index name highlighted in the article.
Disclosure
We use a combination of fundamental and technical analysis in forming our view as to the valuation and prospects of an investment. Where relevant we have set out those particular matters we think are important in the above article, but further detail can be found here.
Please note that our article on this investment should not be considered to be a regular publication.
Details of all recommendations issued by ii during the previous 12-month period can be found here.
ii adheres to a strict code of conduct. Contributors may hold shares or have other interests in companies included in these portfolios, which could create a conflict of interests. Contributors intending to write about any financial instruments in which they have an interest are required to disclose such interest to ii and in the article itself. ii will at all times consider whether such interest impairs the objectivity of the recommendation.
In addition, individuals involved in the production of investment articles are subject to a personal account dealing restriction, which prevents them from placing a transaction in the specified instrument(s) for a period before and for five working days after such publication. This is to avoid personal interests conflicting with the interests of the recipients of those investment articles.