Chart of the week: Time to take profits on this star stock?
23rd October 2017 11:32
by John Burford from interactive investor
Share on
Is it time to take Anglo American profits?
has been a star performer for us since last year. It has faithfully followed the rules and guidelines contained in the Elliott Wave Theory (one of the three pillars of my Tramline method).
And one of the other pillars is my use of the Fibonacci levels which can provide highly accurate targets where profits can be taken, if indicated. Combined with my tramline concepts, my method can often give accurate entries and exits (as well as sensible stops) - and today I have just an example of how this works in practice.
This is the long-range chart I showed last time I covered it on 17 July.

From the 2011 high at the £34 level, I have a very clear 'five waves down' to the fifth wave low at £9.50 on 21 June 2016. Note the momentum divergence between the values at the waves 1 and 5 lows. I like to see momentum divergences when I suspect a major turn is at hand. That was a very substantial decline of £24.50 (72%) in five years.
So, what is going on in such conditions? Trends do not last forever and when they reverse, the selling power that has driven prices down is finally overcome by the buying strength. This buying power emerges from a combination of short covering (profit-takers), fewer bears to enter the market and bargain hunting (buying). This re-alignment of forces is often captured by the momentum indicator.
Those that are selling near the lows are trend-followers whose strategy has been entirely correct for five years. The large institutions (hedge funds, banks, and so on) are largely trend-followers.
But those following the Elliott Wave model know that the waves on the charts are patterned often in recognisable ways - and the most reliable is the five-wave pattern, and the current example is a textbook case.
Given the scale of the bear run, a reasonable assumption is that a forecast subsequent relief rally - hopefully in a textbook A-B-C - would run to at least a Fibonacci 38% retrace in 1-½ years or so. That would preserve the right 'look'.
This is my conclusion back in July with the shares trading around the £11 area:
"All of these factors are conducive to a bullish stance here with a target at the old highs in the £14 area with higher potential thereafter."
Here is the updated chart showing the rally off the 2016 low:
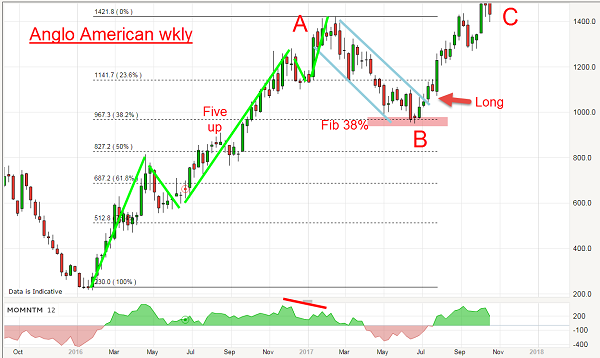
In the top chart of July, I had a target at the Fibonacci 38% level at around the £14 area to complete the C wave. The lower chart shows this target has been achieved.
Of course, the market can move much higher from here - perhaps up to the next Fibonacci level at around £18, but there are clues this may not happen.
Here is the long-term chart of the copper price that I have been tracking:

The rally off the January 2016 low has taken it to the precise Fibonacci 50% retrace if the big wave down off the 2011 high - a typical turning point.
With any further upside progress in the copper price looking to be hard-won, it is prudent to take at least some profits off the table here at the £14.30 area. If the shares do decline below the recent £13 low, it is also prudent to set protect-profit stops on the remainder position there.
Naturally, if we get a surprise rally continuation to the £18 region, that would be a prudent place to take all remaining profits. But the key is that no matter what the shares do now, we have locked in a profit at a sensible place and have the potential to make additional gains on any further upside. And we have taken the trade at low risk in a fully professional way.
These articles are provided for information purposes only. Occasionally, an opinion about whether to buy or sell a specific investment may be provided by third parties. The content is not intended to be a personal recommendation to buy or sell any financial instrument or product, or to adopt any investment strategy as it is not provided based on an assessment of your investing knowledge and experience, your financial situation or your investment objectives. The value of your investments, and the income derived from them, may go down as well as up. You may not get back all the money that you invest. The investments referred to in this article may not be suitable for all investors, and if in doubt, an investor should seek advice from a qualified investment adviser.
Full performance can be found on the company or index summary page on the interactive investor website. Simply click on the company's or index name highlighted in the article.
Disclosure
We use a combination of fundamental and technical analysis in forming our view as to the valuation and prospects of an investment. Where relevant we have set out those particular matters we think are important in the above article, but further detail can be found here.
Please note that our article on this investment should not be considered to be a regular publication.
Details of all recommendations issued by ii during the previous 12-month period can be found here.
ii adheres to a strict code of conduct. Contributors may hold shares or have other interests in companies included in these portfolios, which could create a conflict of interests. Contributors intending to write about any financial instruments in which they have an interest are required to disclose such interest to ii and in the article itself. ii will at all times consider whether such interest impairs the objectivity of the recommendation.
In addition, individuals involved in the production of investment articles are subject to a personal account dealing restriction, which prevents them from placing a transaction in the specified instrument(s) for a period before and for five working days after such publication. This is to avoid personal interests conflicting with the interests of the recipients of those investment articles.