Chart of the week: How long can FTSE 100 rally last?
2nd January 2018 12:15
by John Burford from interactive investor
Share on
The FTSE has climbed onto a cliff edge
The month of December saw a vigorous Santa rally, with the index climbing from a low of 7,280 to Friday's all-time high of 7,704 - a huge gain of 424 points (5.8%) in the month.
Many are asking: can this trend last into 2018? As this is my first post of the New Year, I will present evidence that answers that question in the negative. If my analysis is correct, shares are due for a severe correction - and soon.
In my previous post on the FTSE on 13 November, I laid out a case that the FTSE would suffer a prompt decline, which in fact it did. From the 6 November market at 7,535, the index dipped to the 7,280 level on 1 December - a tradeable move of over 150 pips.
Because the wave patterns were suggesting a renewed rally phase lay ahead, I then looked for a low-risk long entry and rode the substantial rally into Friday.
But with the chart patterns strongly suggesting a major high is either here or very close, I am looking for an exit for my longs and a place to take a new short position.
The weekly chart for the year below demonstrates my thinking:
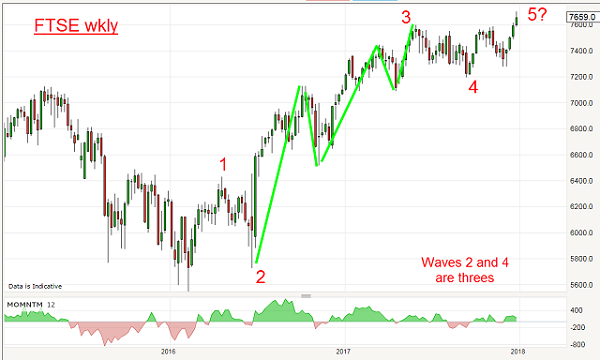
Remember, I am always looking for a complete five waves up at many degrees of trend because a five-up count means the uptrend is over and the opposing downtrend is taking its place.
My wave labels obey all of Elliott's rules and guidelines and note wave 3 contains its own five-up (green bars), and even the green wave 3 contains its one smaller-scale five up. Markets really are fractals.
With last week's move above the wave 3 high (the bare minimum for a complete fifth wave), I can now start looking for the turn. For clues, here is the four-hour chart showing wave 5 in more detail:
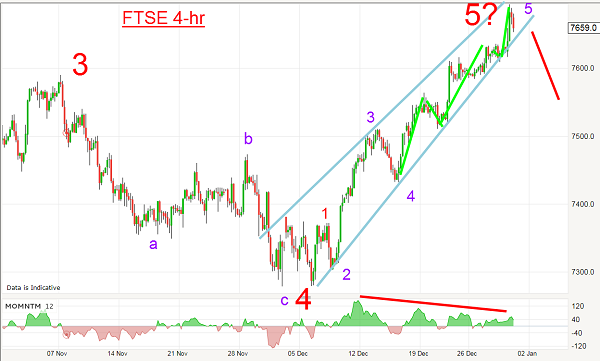
From the wave 4 low, I can count a five-up and, crucially, the rally has been contained within a wedge pattern. When these appear after a substantial run, it is called an ending diagonal - and heralds a complete reversal of the previous wave when complete.
In addition, I can count a potentially complete five-up to Friday's 7,704 high with an extended fifth wave (common in share charts). But the big bonus is the huge momentum divergence all of the way up the fifth wave. That shows the wave 5 rally lies on shaky ground.
Another interesting point is that, while the FTSE has been influenced by what is happening in the sterling market (a lower pound translates into larger dividends and hence higher share prices), the very substantial FTSE rally in December had a fairly stable sterling backdrop. Compare that with the very weak German DAX index as the euro soared in the month (and is continuing today).
But with sterling showing signs of moving higher, can the FTSE continue its rally in defiance of the currency?
If my analysis is correct, we should see a swift move below the lower wedge line in the 7,600 region. A hard close below that level would swing the odds very much in favour of a bearish stance for weeks to come.
I understand this view is in a minority - most money managers expect a continuation of the general uptrend for 2018. But they always do!
This article is for information and discussion purposes only and does not form a recommendation to invest or otherwise. The value of an investment may fall. The investments referred to in this article may not be suitable for all investors, and if in doubt, an investor should seek advice from a qualified investment adviser.
These articles are provided for information purposes only. Occasionally, an opinion about whether to buy or sell a specific investment may be provided by third parties. The content is not intended to be a personal recommendation to buy or sell any financial instrument or product, or to adopt any investment strategy as it is not provided based on an assessment of your investing knowledge and experience, your financial situation or your investment objectives. The value of your investments, and the income derived from them, may go down as well as up. You may not get back all the money that you invest. The investments referred to in this article may not be suitable for all investors, and if in doubt, an investor should seek advice from a qualified investment adviser.
Full performance can be found on the company or index summary page on the interactive investor website. Simply click on the company's or index name highlighted in the article.
Disclosure
We use a combination of fundamental and technical analysis in forming our view as to the valuation and prospects of an investment. Where relevant we have set out those particular matters we think are important in the above article, but further detail can be found here.
Please note that our article on this investment should not be considered to be a regular publication.
Details of all recommendations issued by ii during the previous 12-month period can be found here.
ii adheres to a strict code of conduct. Contributors may hold shares or have other interests in companies included in these portfolios, which could create a conflict of interests. Contributors intending to write about any financial instruments in which they have an interest are required to disclose such interest to ii and in the article itself. ii will at all times consider whether such interest impairs the objectivity of the recommendation.
In addition, individuals involved in the production of investment articles are subject to a personal account dealing restriction, which prevents them from placing a transaction in the specified instrument(s) for a period before and for five working days after such publication. This is to avoid personal interests conflicting with the interests of the recipients of those investment articles.