Chart of the week: FTSE 100 - a buy or a falling knife?
5th February 2018 11:42
I confess I was struggling on the immediate direction of FTSE 100 - until last week. Two weeks ago, I posed my analysis on FTSE that put the odds good for a significant advance, provided it did not trade under the 7,680 level in the near term.
Then a week later, after it had traded below that critical support level to the 7,600 level for a small loss, I re-appraised the situation and concluded that the trend was still likely to be up, but only if the 7,600 level held and the pink trendline could be penetrated.
This was the chart I showed last week:
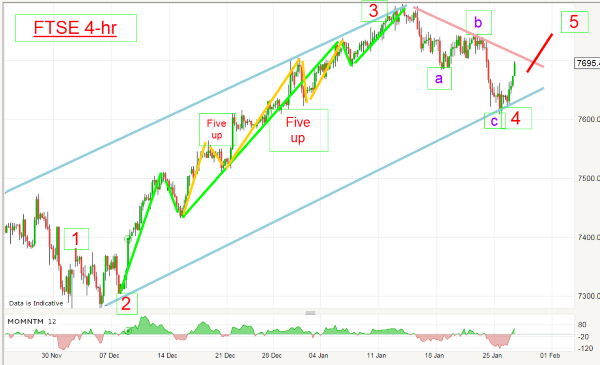
I was expecting a move to a new high in the final wave 5 if the above conditions could be met – and that was my best guess at the time.
But a funny thing happened on the way to the new high – it didn't happen! The budding rally petered out and the pink trendline was never penetrated. Then, on Tuesday, the market came under severe pressure and broke hard below the lower tramline. That is almost always a bearish event, and gave a true sell signal in the 7,600 area. And this is the picture this morning:
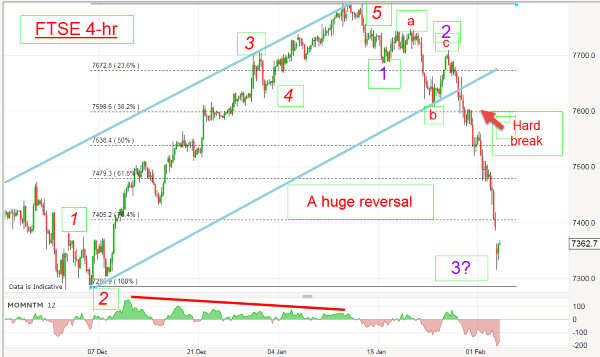
It is not a pretty sight for the bulls!
So now I have my amended Elliott wave labels that make a better fit. I have a complete five up to the 7,800 high and waves 1,2 and 3 of what should become a five down. (I have put a query on wave 3 because it may not have completed yet.) And if that scenario occurs, that will be the first large wave down of what will become a larger five down. This is a very bearish outlook indeed.
Note the large momentum divergence as the market moved up into the 7,800 high that showed the rally was on borrowed time for weeks. The buying power was getting weaker as the rally progressed to the high. I like to observe these divergences because it allows for preparation for a possible trend change.
Now with the market hard down below the Fibonacci 78% 'last chance saloon' at around 7,400, it has lost over 400 points in 16 days – a span that took 30 days on the way up from 8 December.
As they say, 'Markets fall out of the window faster than they climb the stairs.'
So now we are in a third wave down, my best guess is when that wave concludes, we shall see a fourth wave bounce (in perhaps an A-B-C form) and then a move to new lows in wave 5 that should come in below the 7,280 level.
It is clear the mood of the market has turned on a dime and major upside progress will be very difficult to achieve, if not highly unlikely. The path of least resistance is now down.
And here is the FTSE 250 index of smaller companies that also shows very bearish tendencies
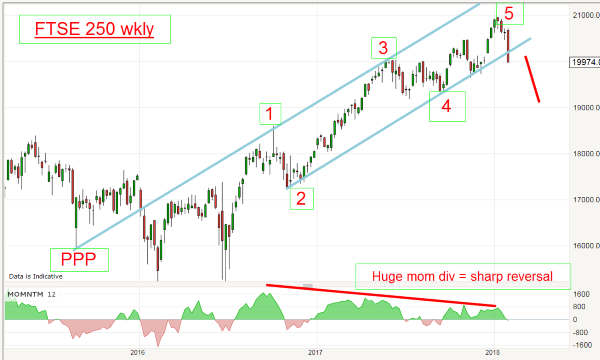
I have a superb tramline pair containing the five waves up of the entire rally with the upper tramline sporting a lovely Prior Pivot Point (PPP). On Friday, the market closed below the lower tramline in a new sell signal – and has continued lower this morning. Note also the large momentum divergence that matches that in the FTSE chart.
It doesn't look very encouraging for the bulls.
ii publishes information and ideas which are of interest to investors. Any recommendation made in this article is based on the views of the writer, which do not take into account your circumstances. This is not a personal recommendation. If you are in any doubt as to the action you should take, please consult an authorised investment adviser. ii do not, under any circumstances, accept liability for losses suffered by readers as a result of their investment decisions.
The value of your investments, and the income derived from them, may go down as well as up. You may not get back all the money that you invest.
These articles are provided for information purposes only. Occasionally, an opinion about whether to buy or sell a specific investment may be provided by third parties. The content is not intended to be a personal recommendation to buy or sell any financial instrument or product, or to adopt any investment strategy as it is not provided based on an assessment of your investing knowledge and experience, your financial situation or your investment objectives. The value of your investments, and the income derived from them, may go down as well as up. You may not get back all the money that you invest. The investments referred to in this article may not be suitable for all investors, and if in doubt, an investor should seek advice from a qualified investment adviser.
Full performance can be found on the company or index summary page on the interactive investor website. Simply click on the company's or index name highlighted in the article.
Disclosure
We use a combination of fundamental and technical analysis in forming our view as to the valuation and prospects of an investment. Where relevant we have set out those particular matters we think are important in the above article, but further detail can be found here.
Please note that our article on this investment should not be considered to be a regular publication.
Details of all recommendations issued by ii during the previous 12-month period can be found here.
ii adheres to a strict code of conduct. Contributors may hold shares or have other interests in companies included in these portfolios, which could create a conflict of interests. Contributors intending to write about any financial instruments in which they have an interest are required to disclose such interest to ii and in the article itself. ii will at all times consider whether such interest impairs the objectivity of the recommendation.
In addition, individuals involved in the production of investment articles are subject to a personal account dealing restriction, which prevents them from placing a transaction in the specified instrument(s) for a period before and for five working days after such publication. This is to avoid personal interests conflicting with the interests of the recipients of those investment articles.
Editor's Picks