Chart of the week: Short and long-term outlook for FTSE 250
12th February 2018 11:22
by John Burford from interactive investor
Share on
A relief rally is due now after last week's plunge
Most traders focus on the , but its little sister the is worthy of attention too. Many UK investors have investments within this index. Whereas the FTSE 100 index comprises the 100 most heavily capitalised companies listed on the LSE - which are loaded with overseas commodity producers who earn dollars - the 250 is made up of the next 250 heaviest caps. And these are mainly UK-based operations which earn in sterling.
That is why the charts of the two indexes often differ in character as investors judge the relative attractions of the currency exchange rates. Recently, sterling has appreciated against the dollar, but that appears to be changing.
- Chart of the week: FTSE 100 - a buy or a falling knife?
Last week, I showed this chart of the 250 that showed how vulnerable it was to a big slide.
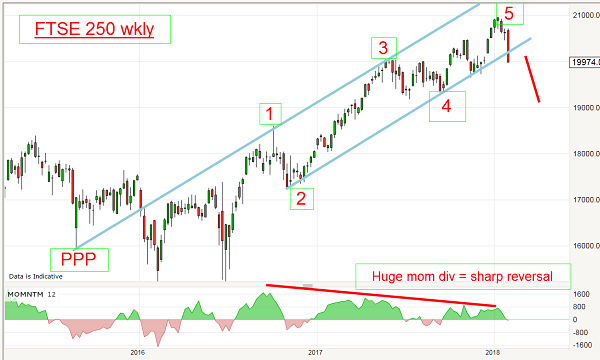
I noted that the rally off the 2016 lows is well contained within the trading channel bounded by my blue tramline pair and the entire advance sports a five Elliott wave impulsive pattern complete with a large momentum divergence at the high. This is a classic setup for a reversal.
According to the Elliott wave theory, when the fifth wave of an impulse exhausts, the market then moves down in a new bear phase in a three. This theory has been tested time and time again and proved to apply in the vast majority of cases.
But how can you be sure the fifth wave has competed when trading in real time? One of the signals I use is to watch for a break of the lower tramline. As you can see, that break was in progress last Monday. And that gave me my sell signal.
One further clue to expect a sharp break was the action of the momentum oscillator. The huge divergences leading up to the 21,000 area top was a solid clue that the rally was on weak footings, and the break, when it came, would very likely be harsh.
So maximum confidence could be placed on your short trade at the 20,200 level. Of course, that was also a great place to exit long positions.
And right on cue, all stockmarkets were in panic selling mode on Tuesday - and that was fully flagged by the previous wave and momentum action I have described.
This is the picture this morning:
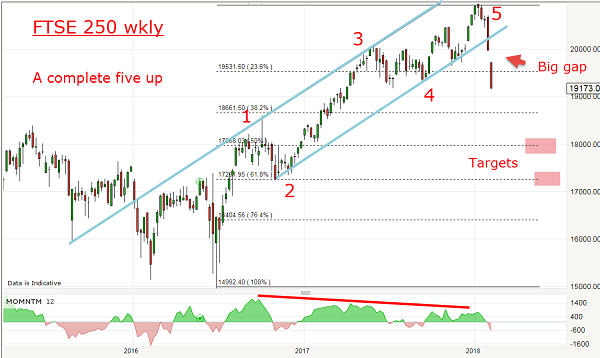
Last week's action opened with a huge gap down and, for chart readers, gaps are hugely significant.
There are several types of gap in classical technical analysis - and this one looks very much like a 'breakaway gap' which usually occurs near the start of a new trend.
Gaps act as magnets. Most common gaps are filled in quickly (and act as an attractive magnet) and have no further significance for price forecasting. But breakaway gaps are not, and the gap remains, and it acts like a repulsive magnet for prices. This type holds great promise for forecasting!
But with several stock indexes showing five waves down to Friday morning's low, and with markets deeply oversold near-term, odds favour a bounce phase near term - hopefully in a three-wave pattern. But this should be counter to the new downtrend.
Prudence suggests investors use this opportunity to lighten up on holdings, particularly if they are richly priced for perfection, as so many are. It appears perfection will be delayed yet again.
ii publishes information and ideas which are of interest to investors. Any recommendation made in this article is based on the views of the writer, which do not take into account your circumstances. This is not a personal recommendation. If you are in any doubt as to the action you should take, please consult an authorised investment adviser. ii do not, under any circumstances, accept liability for losses suffered by readers as a result of their investment decisions.
The value of your investments, and the income derived from them, may go down as well as up. You may not get back all the money that you invest.
Disclosure
We use a combination of fundamental and technical analysis in forming our view as to the valuation and prospects of an investment. Where relevant we have set out those particular matters we think are important in the above article, but further detail can be found here.
Please note that our article on this investment should not be considered to be a regular publication.
Details of all recommendations issued by ii during the previous 12-month period can be found here.
ii adheres to a strict code of conduct. Members of ii staff may hold shares in companies included in these portfolios, which could create a conflict of interests. Any member of staff intending to write about any financial instruments in which they have an interest are required to disclose such interest to ii and in the article itself. We will at all times consider whether such interest impairs the objectivity of the recommendation.
In addition, staff involved in the production of investment articles are subject to a personal account dealing restriction, which prevents them from placing a transaction in the specified instrument(s) for a period before and for five working days after such publication. This is to avoid personal interests conflicting with the interests of the recipients of those investment articles.
These articles are provided for information purposes only. Occasionally, an opinion about whether to buy or sell a specific investment may be provided by third parties. The content is not intended to be a personal recommendation to buy or sell any financial instrument or product, or to adopt any investment strategy as it is not provided based on an assessment of your investing knowledge and experience, your financial situation or your investment objectives. The value of your investments, and the income derived from them, may go down as well as up. You may not get back all the money that you invest. The investments referred to in this article may not be suitable for all investors, and if in doubt, an investor should seek advice from a qualified investment adviser.
Full performance can be found on the company or index summary page on the interactive investor website. Simply click on the company's or index name highlighted in the article.
Disclosure
We use a combination of fundamental and technical analysis in forming our view as to the valuation and prospects of an investment. Where relevant we have set out those particular matters we think are important in the above article, but further detail can be found here.
Please note that our article on this investment should not be considered to be a regular publication.
Details of all recommendations issued by ii during the previous 12-month period can be found here.
ii adheres to a strict code of conduct. Contributors may hold shares or have other interests in companies included in these portfolios, which could create a conflict of interests. Contributors intending to write about any financial instruments in which they have an interest are required to disclose such interest to ii and in the article itself. ii will at all times consider whether such interest impairs the objectivity of the recommendation.
In addition, individuals involved in the production of investment articles are subject to a personal account dealing restriction, which prevents them from placing a transaction in the specified instrument(s) for a period before and for five working days after such publication. This is to avoid personal interests conflicting with the interests of the recipients of those investment articles.